
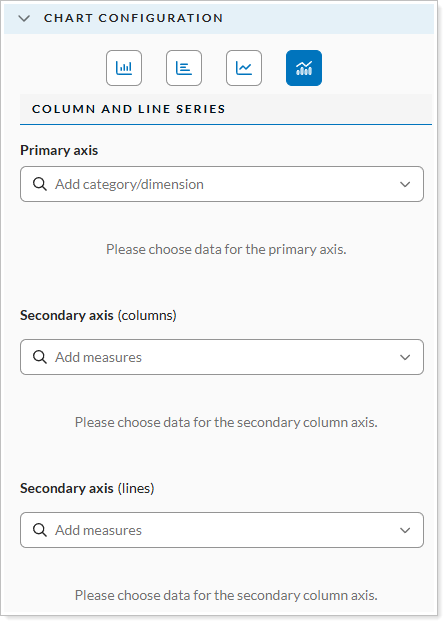
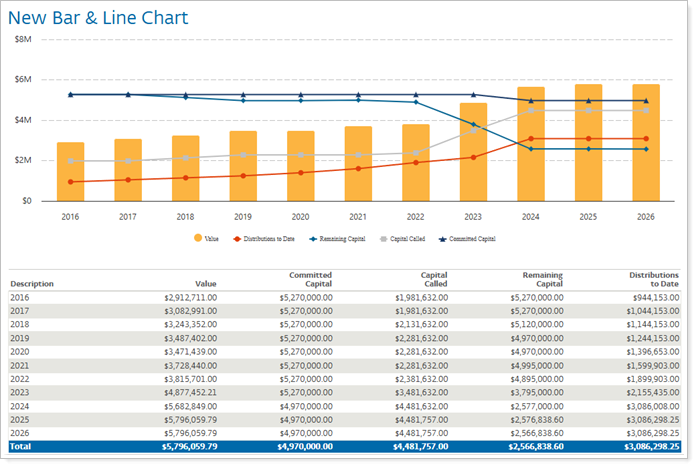
In Report Studio, a column and line series combines vertical columns with a connected line of data points on the same chart. Use it to visualize trends, performance, or change over time.
For more information, see Introduction to Report Studio.