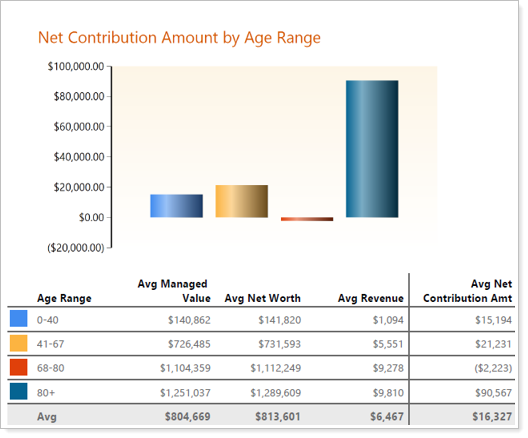
This chart graphic is showing Average Net Contribution Amount (Series/Y axis) by Age Range (Category/X axis). The chart breakdown is showing, by Age Range, calculations of each of the columns with a final total that should match with the information in the fields in the top portion of the report. The only difference being Average Net Contribution Amount showing a dollar amount based on Contributions showing on Financial Accounts underlying the Household Account, which is integrated from Reporting.