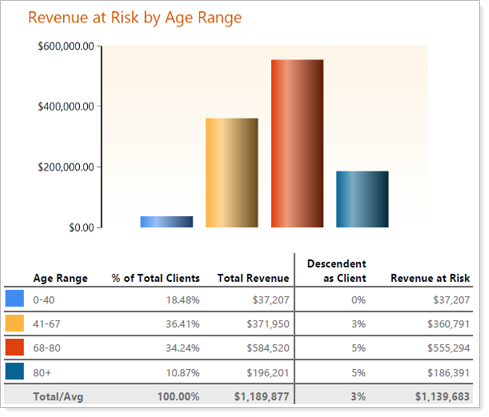
This chart graphic is showing Revenue at Risk (Series/Y axis) by Age Range (Category/X axis). The chart breakdown is showing, by Age Range, the percentage of clients that fall into each range, as well as the total amount of revenue held in each. The Descendent as Client is a percentage of clients within the age range have descendants who are clients (if Family field value not empty). The Revenue at Risk calculation the Total Revenue minus the individual Total Revenue for those Accounts that have Family field filled in. The Total/Avg row is the total for each column, with the Descendent as Client column being an average.