 Back
Back Home > Tamarac Reporting > Data Setup & Calculations > Calculations > Show Returns Across Holdings Gaps
|
Back |
Home > Tamarac Reporting > Data Setup & Calculations > Calculations > Show Returns Across Holdings Gaps
|
Show Returns Across Holdings Gaps
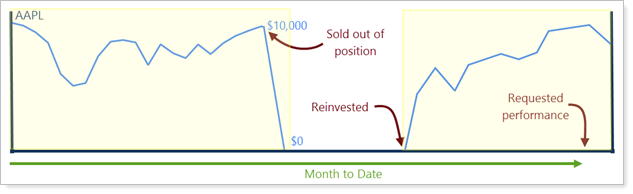
If you choose, you can see returns across holdings gaps. When you enable the enhanced performance calculations, you'll have deeper access to historical performance data at both the position and account level. With the legacy calculation, performance was displayed for only the most recently held period of a position, but with the enhanced calculation your reports can calculate performance for all holding periods and then aggregate that data.
With the enhanced calculation, you'll see the following functionality:
The Account Analytics report displays return information for the last contiguous account period, but it does not have any logic to link returns across gaps.
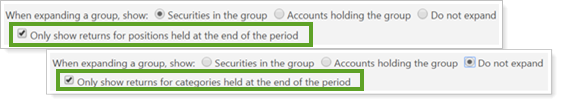
For the Account Performance report, you can choose what to show when you expand a group—you can show either category or security positions that were held during a selected period.
The charts and tables for Account Performance also will be influenced by this option—the bar chart will show all returns across the full date period, but the line chart will show only the last contiguously held date period. For tables, lines that do not include data will be dropped.
To take advantage of the enhanced calculations, contact your Tamarac Service Team. You will need to have intra-group flows enabled before you can use the enhanced calculations.