
Contents
Reporting
New home page for Report Studio
This update introduces a new Report Studio home page that makes it easier to see and organize all your saved and shared modules, sections, and reports. The new design helps you find what you use most, so you can keep track of your reports.
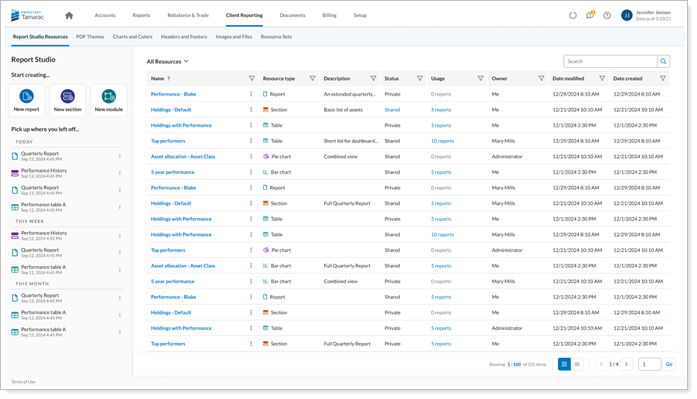
Now, instead of going straight into building a report, you’ll start on a dashboard that shows you all your reporting tools at a glance. This dashboard makes it faster to find the files and features you need. Starting here helps you work more efficiently, makes it easier for new users to learn, and encourages you to use Report Studio more often.
When you open Report Studio, you can:
-
Find your saved and shared modules, sections, and reports fast.
-
Organize your files with simple tools.
-
Delete or bring back items when you need to.
-
And more.
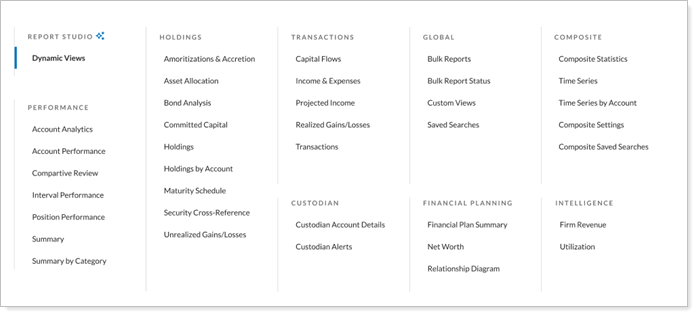
Dynamic views in Report Studio
This update makes Report Studio easier to use and more interactive when working with reports. You can look at your report data, use filters to narrow down what you see, and study results right on your screen. Saving parts of your reports in a dynamic format only takes a few steps, and you can find these saved sections in the Reports menu.
The new charts are also more interactive. When you move your mouse over a chart, extra details appear, and you can use filters to focus on certain data without having to start over. These new features make it faster and easier to analyze your reports and find important information.