
Contents
Report Studio
Track daily return, value, and net investment on Report Studio line charts
What's changing
We know how much value you get out of today's capital flows line chart, which lets you compare account value with net investment. We're excited to announce that Report Studio now supports displaying daily return, daily value, and daily net investment values as a secondary axis on bar and line charts. This is the same data you can already line chart on Account Performance and Capital Flows charts, now available more broadly.
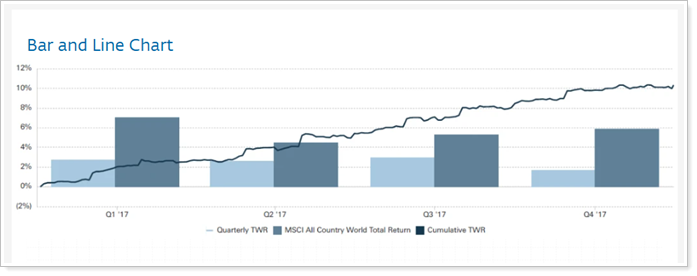
You can view this data at daily, monthly, quarterly, or yearly intervals.
Why you'd use it
How often have you wished you could show daily returns, net investments, or account values on the same chart alongside portfolio values, cumulative or time-weighted returns, or benchmarks? With this enhancement, you can include these secondary values for direct comparison, allowing you to tell much more nuanced stories about clients' account performance.
How to get started
To use these secondary axis options, set the primary axis to Dates.
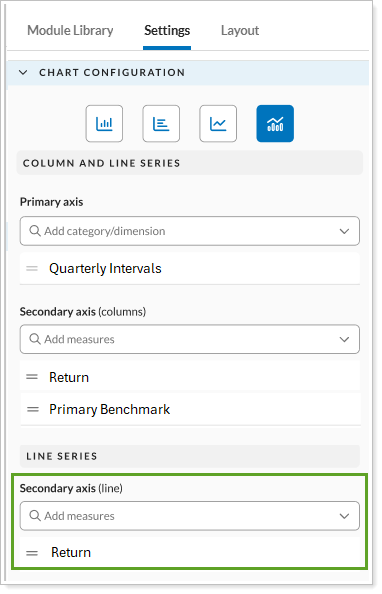
In the Settings for a line chart or a combination line and bar chart, under the Secondary Axis (lines), in the Daily Line Chart section, select one of the following options:
-
Daily Return. Show the net or gross TWR alongside the primary axis values. Use this when you want to compare the daily returns with dollar values. For example, show portfolio market value on the primary axis and daily return on the secondary axis.
-
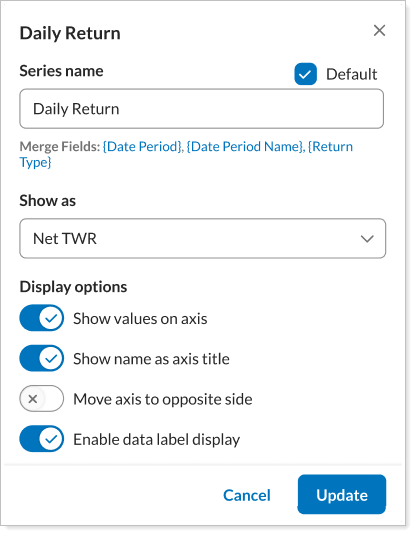
Daily Net Investment. Show the net investment amount in dollars alongside the primary axis values. For example, compare flows with returns to help distinguish cash movements from market performance.
-
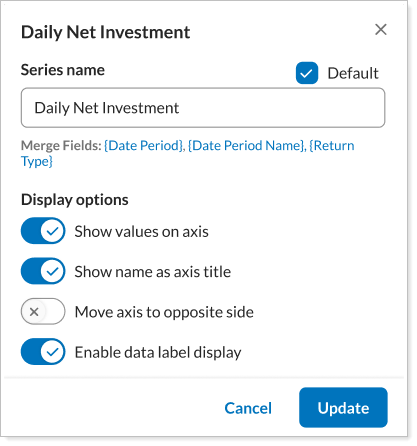
Daily Value. Show the account or group's daily dollar value alongside the primary axis data. For example, this helps show the actual real dollar value that clients care about, along with benchmark and cumulative returns that help you measure a portfolio's success.
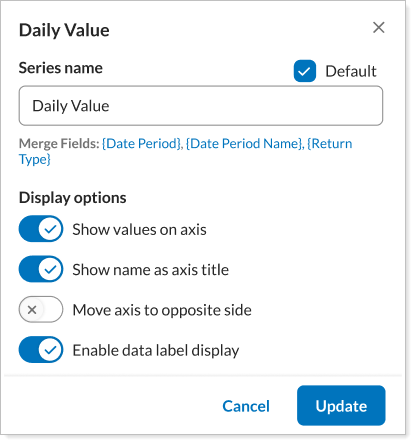
Configure the selected series as desired and select Update. The chart shows the additional data as a line on a secondary axis.
Control pie chart label text wrapping and currency display
What's changing
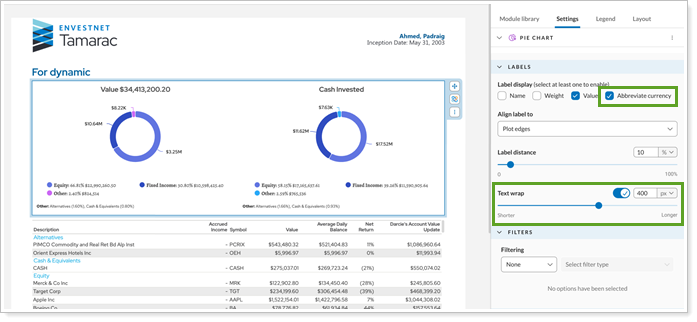
In Report Studio modules, you can arrange pages with as many charts, tables, and graphs as you want. When you arrange multiple charts side-by-side in Report Studio, space can become limited, making pie chart labels harder to read. To give you more control over how labels behave, you can now shorten currency values and control when label text wraps.
Why you'd use it
Controlling how individual pie charts handle currency and text wrapping lets you customize how chart labels look on each report. When you have plenty of space, you can keep the default settings. When you need to optimize for tight space, you can adjust the text wrapping and currency display to improve readability when displaying multiple charts in a smaller area.
How to get started
In the Report Studio module containing the pie chart you want to adjust, open the chart Settings.
-
To shorten currency values: If you've selected currency Value for the label, also select Abbreviate currency.
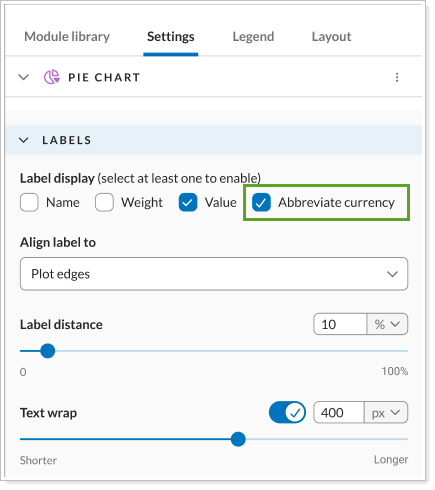
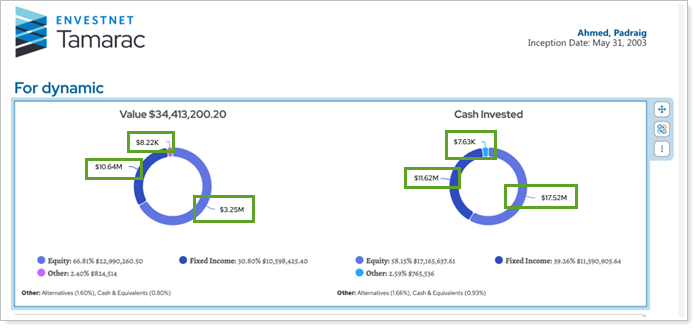
This shortens currency values to commonly used abbreviations. For example, $2,200 appears as $2.2K and $1,500,000, appears as $1.5M.
-
To control text wrapping: Turn on Text wrap and specify the width in pixels at which text begins wrapping.
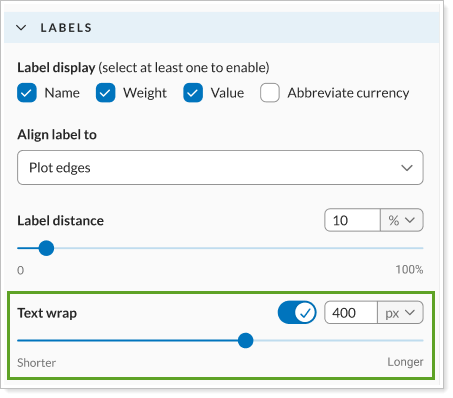
When a pie chart label reaches the specified width, it wraps to the next line.
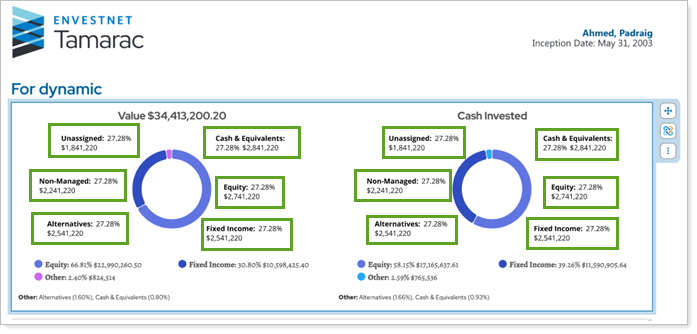
These settings affect only pie chart labels. Currency values in legends and titles still continue to display in full, and their default text wrapping remains unchanged.
Export Report Studio modules data as CSV
What's changing
We know how much you value the ability to export data from dynamic views. With this release, we've expanded this popular feature to Report Studio. You can now export data from a Report Studio module to a CSV file, much like you already do in dynamic views.
With this release, you can export data from the following Report Studio module types:
-
Pie chart.
-
Table.
The export contains such information as:
-
Module name.
-
Default date period name and range.
-
Data For, which identifies the account or group displayed in the module.
-
Whether the asset was managed, unmanaged, or combined.
-
Grouping hierarchy, if applicable.
-
Chart-specific secondary axis values, if applicable.
-
And more.
Example
You export the data from the following module:
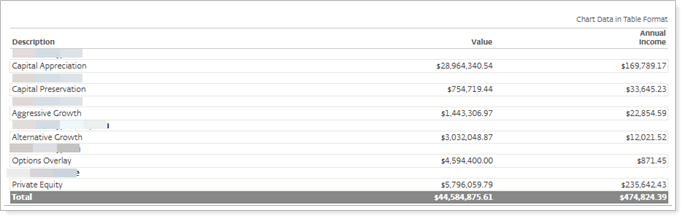
The exported CSV file you download looks like this:

Why you'd use it
This enhancement allows you to export module data to CSV files for further analysis, sharing, or use outside the platform, without manually recreating the data.
How to get started
In the Report Studio pie chart or table module, select the module edit menu and choose CSV Export.
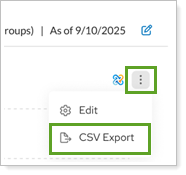
The CSV file automatically downloads to your computer.
Stack secondary axis data points on Report Studio bar charts
What's changing
Sometimes bar charts make more sense as stacked bars rather than side-by-side bars, especially when comparing multiple data types. For example, when reporting on income, you might want to show how interest and dividends contribute to total income. The stacked bar chart can then show income contributions from interest and dividends and how each contributes to the total.
With this release, you can now stack secondary axis values in Report Studio bar charts to show the contribution of each data point to the overall total.
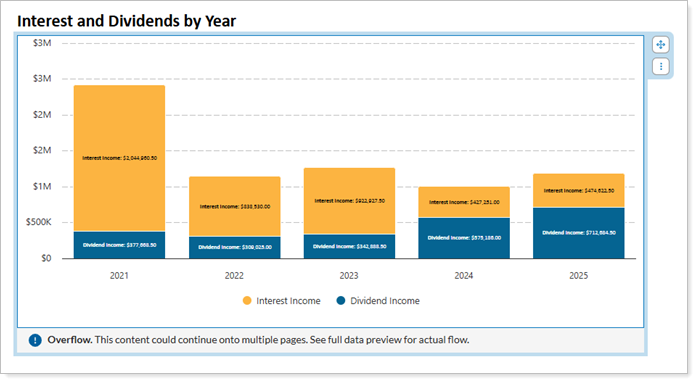
Vertical and horizontal bar charts both support stacking.
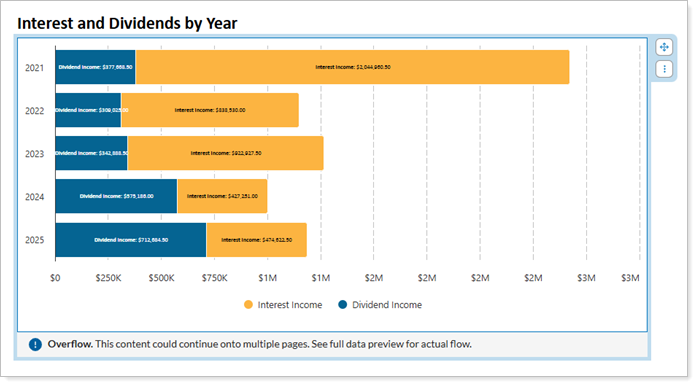
The following limitations apply:
-
You can't stack line charts.
-
You can't use secondary grouping options if you turn on stacking.
Why you'd use it
Use stacked bar charts to show how multiple data points all contribute to one total value. Stacking secondary data values allows you to tell the story of all the contributors to one overall data point, rather than implying that they're separate values to compare.
How to get started
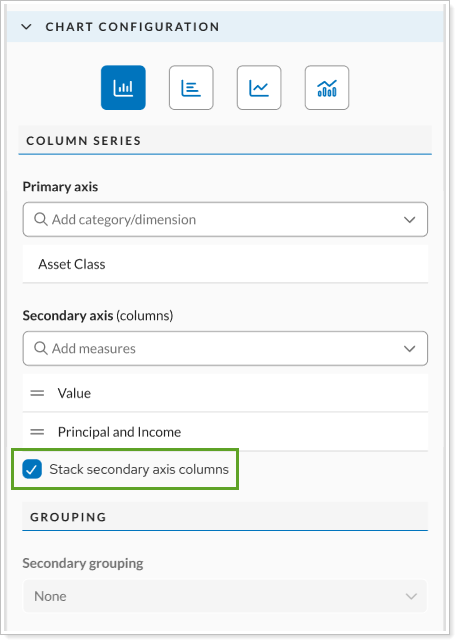
Stacking is only available for vertical and horizontal bar charts when you add two or more secondary axis selections.
To enable stacking, select Stack secondary axis columns.
User management
Manage users directly in Tamarac
What's changing
As a firm administrator, you need to add new advisor users, keep their details up to date, and remove access when someone leaves. In the past, most of these changes required a request to Tamarac Support, and the only way to remove access was to delete the advisor user's profile and reassign their assets.
With this release, your firm gets direct control over your team’s Tamarac access. Authorized firm administrators can add, update, deactivate, and assign permissions to firm staff directly in Tamarac, without needing to route requests through support.
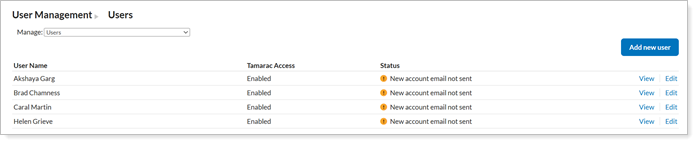
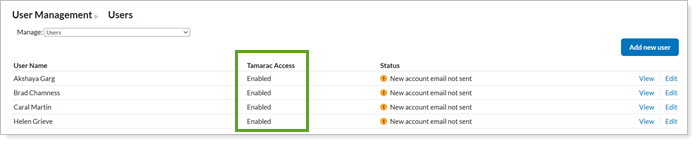
With this enhancement, you can track each user's access permissions on the Users page with the Tamarac Access column.
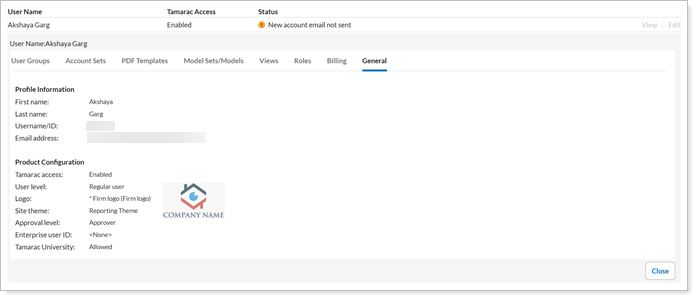
Additionally, you can view advisor users to see a read-only summary of an advisor user's profile and product settings.
Why you'd use it
This enhancement streamlines your processes by putting advisor user setup in your hands. Add and update advisor users on your own schedule, and disable access when someone goes on leave or leaves the firm, without losing their setup.
How to get started
You must have administrator permission to manage advisor users.
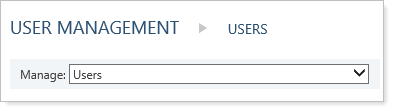
To manage advisor users, under Setup, choose User Management. In the Manage list, select Users.
-
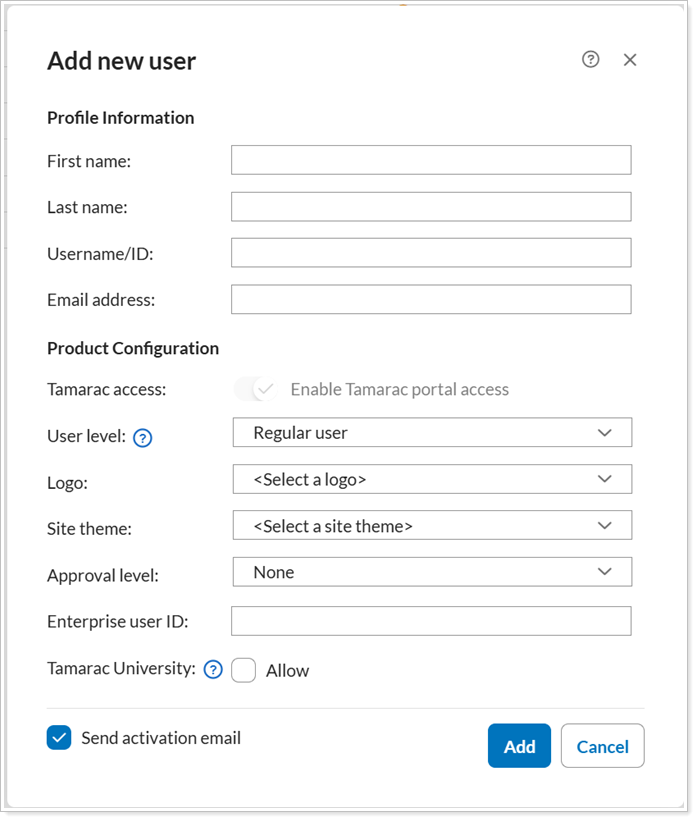
Add advisor users. To create an advisor user with the Admin or Regular user level, select Add new user. New advisor users have Tamarac access enabled by default.
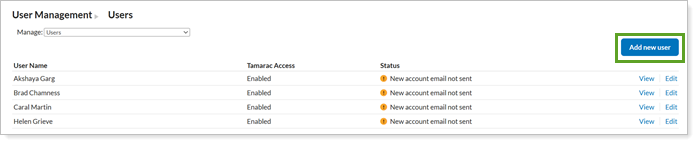
Complete the new user details as desired and select Add.
-
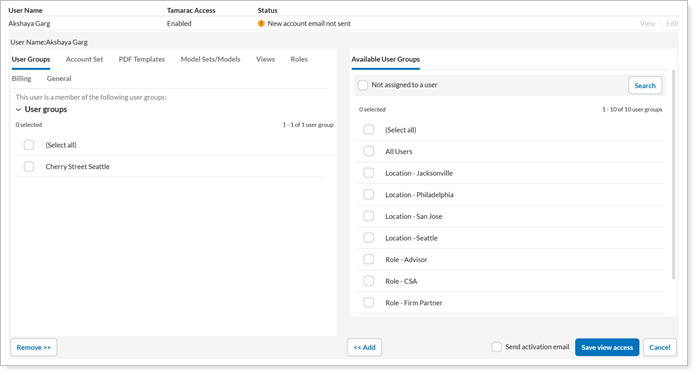
Edit advisor users. To change an advisor's user fields, including user level, select Edit next to the user you want to change. If you change their level, permissions update to match the new level.

Adjust the options as desired.
-
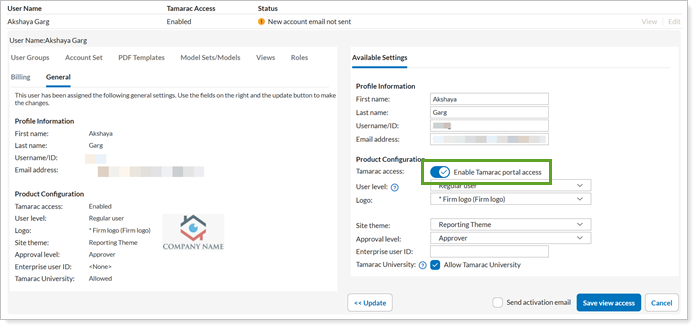
Enable or disable access. When an advisor should no longer have access to the Tamarac platform, under the user's record, under General and turn off Enable Tamarac portal access. This prevents their username and password and SSO access without deleting their profile.
Reporting
Calculate group-level performance for account-level intervals
What's changing
In the past, reporting group performance could be difficult when you used manual performance intervals, such as when moving accounts between groups or households, onboarding a new book of business, or adding off-platform data. You had to maintain group performance manually, resulting in a largely static value.
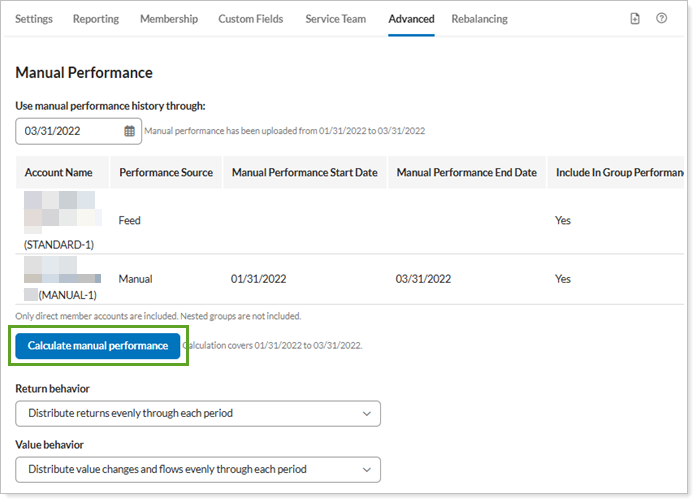
Now, you can calculate group performance with one click directly from a Tamarac group. When you use this manual calculation, Tamarac gathers daily interval data across all qualifying member accounts, aggregates the history, and stores it as the group’s manual track record. It displays the active date range for reference.
Why you'd use it
Use this feature to save time in calculating group performance and enhance the quality of your reporting for manual performance.
How to get started
To use manual group performance calculation, the group must contain one or more member account with existing uploaded manual performance data.
On the group, under Advanced, select Manual Performance. Select Calculate manual performance.
The calculation must be manually initiated. It never runs automatically in the background or changes existing group performance unless you explicitly run it.