
Contents
|
New Bar Chart on the Projected Income Report Additional Data Options for the Summary and Dashboard Sections of PDF Templates |
New Bar Chart on the Projected Income Report
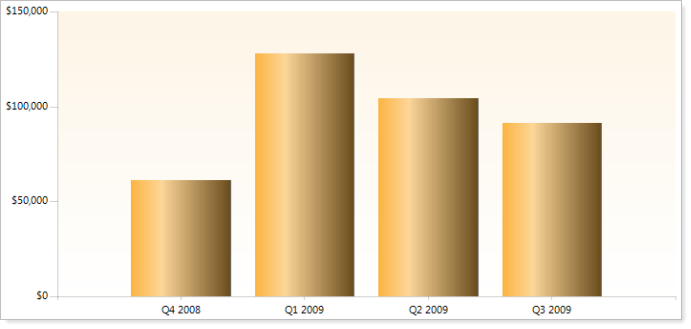
When you view the dynamic and PDF Projected Income report, you now have the option to include a chart so you can see at-a-glance information about projected income. The x-axis of the graph lists the date periods for the report. The y-axis shows the total values for the date period.
Add the Chart to the Dynamic Projected Income Report
To check out this feature, follow these steps:
-
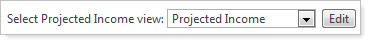
On the Reports menu, click Projected Income.
-
Click Edit.
-
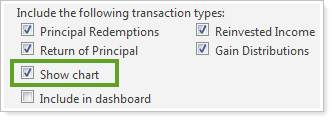
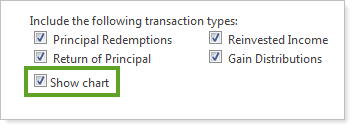
Select the Show chart check box, and then click Apply.
Add the Chart to a PDF Report
To add the chart to a PDF template, follow these steps:
-
On the PDF Templates menu, click Templates.
-
In the Select a template list, choose the PDF template you want to modify. If you haven't created a PDF template, choose Create new template.
-
In the Add a section list, click Projected Income, and then click Add.
-
In the Projected Income section title box, type a name for the report section.
-
Select the Show chart check box.
-
Set any other report settings, and then click Save. The rows you select will print in the report section.
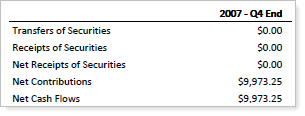
Additional Data Options for the Summary and Dashboard Sections of PDF Templates
With this release, you now have the option of including the following rows on the Summary and Dashboard sections of your PDF templates:
-
Cash Inflows
-
Cash Outflows
-
Receipts of Securities
-
Transfers of Securities
-
Net Receipts of Securities
-
Net Contributions
-
Net Cash Flows
Add the Data to the Summary Section
To add this data to the Summary section of a PDF template, follow these steps:
-
On the PDF Templates menu, click Templates.
-
In the Select a template list, choose the PDF template you want to modify. If you haven't created a PDF template, choose Create new template.
-
In the Add a section list, click Summary, and then click Add.
-
In the Summary section title box, type a name for the report section.
-
Use the Available data and Selected data boxes to configure the rows you want to appear in the Summary section:
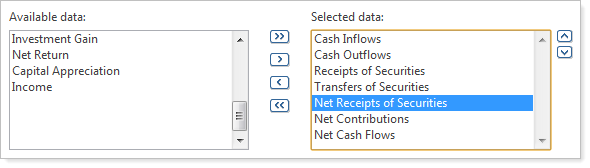
To add a column to the report, in the Available data box, click the row you want to add, and then click >.
To remove a column from the report, in the Selected data box, click the row you want to remove, and then click <.
To add all types of available rows to the report, click >>.
To remove all rows from the report, click <<.
Use the˄ and ˅ buttons to arrange the rows.
-
When finished, click Save.
Add the Data to the Dashboard Section
To add this data to the Dashboard section of a PDF template, follow these steps:
-
On the PDF Templates menu, click Templates.
-
In the Select a template list, choose the PDF template you want to modify. If you haven't created a PDF template, choose Create new template.
-
In the Add a section list, click Dashboard, and then click Add.
-
In the Dashboard section title box, type a name for the report section.
-
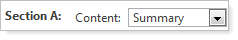
In the Content list for Section A, B, C, or D, click Summary.
-
Use the Available rows and Selected rows boxes to configure the rows you want to appear in the Summary section:
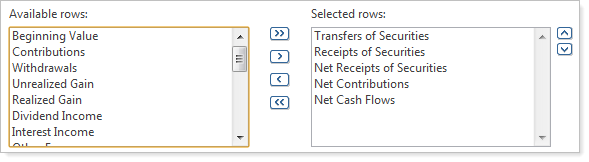
To add a column to the report, in the Available rows box, click the row you want to add, and then click >.
To remove a column from the report, in the Selected rows box, click the row you want to remove, and then click <.
To add all types of available rows to the report, click >>.
To remove all rows from the report, click <<.
Use the ˄ and ˅ buttons to arrange the rows.
-
When finished, click Save.
Client vs. Customer Terminology Change
At our 2011 Tamarac User Conference, many of you suggested that we replace all references to customer with client. We've listened to your requests, and with this release, you'll no longer see the term customer in any part of Advisor View that your clients can see.