
Contents
|
Customize the Columns on the Transactions Report |
Projected Income Report
Over the last year, we've added several new reports that make Advisor View the most powerful reporting tool for financial advisors. Until now, though, you couldn't report on projected income. Today, we're excited to announce that we're introducing the Projected Income report. This report provides data on expected income from dividends, principal repayments, and coupons. You can view the report as a dynamic report or add it to a PDF template.
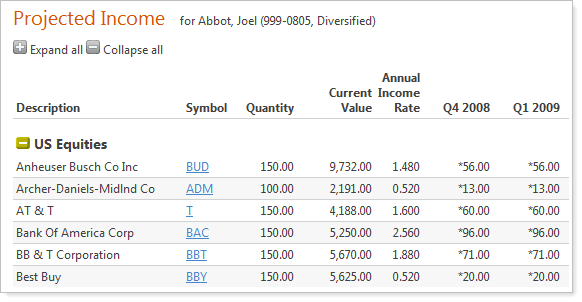
Dynamic Projected Income Report
To view the dynamic Projected Income report, follow these steps:
-
On the Reports menu, click Projected Income.
-
Click Edit.
-
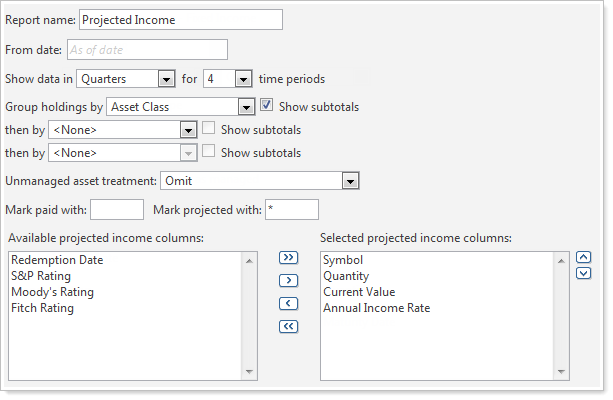
Complete the following information:
| Field | More Information |
|---|---|
| Report name | Type a name for the report. |
| From date | Type a start date for the report. The default is based on the data as of date. |
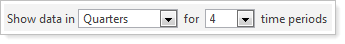
| Show next |
Select the period for which you want to run the report - for example, you can run the report on the next four quarters after the from date.
|
| Group holdings by | Choose how you want to group the holdings that appear on the report. You can group the holdings by security type, asset class, sector or subsector. |
| Show subtotals | Select this check box to include subtotals for the group. |
| Unmanaged asset treatment | Use this list to specify how unmanaged assets are treated. You can choose to omit all unmanaged assets, segregate them in a different section on the Holdings page, or treat them as managed assets. |
| Mark paid with |
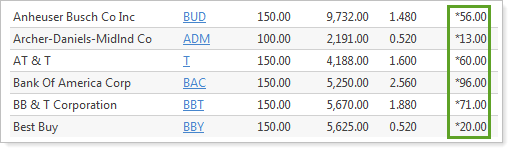
Choose how you want to label paid income on the report. The default option is not to label these items. However, projected income will be labeled with an asterisk. |
| Mark projected income with |
Choose how you want to label projected income. The default option is to label projected income with an asterisk.
|
| Available/Selected columns |
Choose the columns you want to appear on the report. |
| Combine group positions |
With this check box, you have the option to view projected income for each security included in each underlying account, or you can view the projected income for securities held by more than one underlying account in aggregate for the group.
|
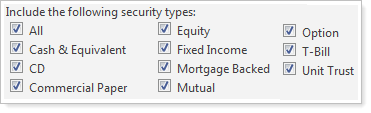
| Include the following security types |
Select the security types you want to appear on the report.
|
| Include the following transaction types |
Select the transaction types you want to appear on the report.
|
| Include in dashboard | Select this check box if you want to add this report to your Advisor View dashboard. |
-
Click Apply.
Projected Income PDF Report
To add projected income to a PDF report template, follow these steps:
-
On the PDF Templates menu, click Templates.
-
In the Select a template list, choose the PDF template you want to modify. If you haven't created a PDF template, choose Create new template.
-
In the Add a section list, click Projected Income, and then click Add.
-
In the Projected Income section title box, type a name for the report section.
-
Complete the following information:
| Field | More Information |
|---|---|
| Report name | Type a name for the report. |
| From date | Type a start date for the report. The default will be the as of date that is selected when you generate the report. |
| Show next |
Select the period for which you want to run the report - for example, you can run the report on the next four quarters after the from date.
|
| Group holdings by | Choose how you want to group the holdings that appear on the report. You can group the holdings by security type, asset class, sector or subsector. |
| Show subtotals | Select this check box to include subtotals for the group. |
| Unmanaged asset treatment | Use this list to specify how unmanaged assets are treated. You can choose to omit all unmanaged assets, segregate them in a different section on the Holdings page, or treat them as managed assets. |
| Mark paid with |
Choose how you want to label paid income on the report. The default option is not to label these items. However, projected income will be labeled with an asterisk. |
| Mark projected income with |
Choose how you want to label projected income. The default option is to label projected income with an asterisk. |
| Available/Selected columns |
Choose the columns you want to appear on the report. |
| Combine group positions |
With this check box, you have the option to view projected income for each security included in each underlying account, or you can view the projected income for securities held by more than one underlying account in aggregate for the group.
|
| Include the following security types |
Select the security types you want to appear on the report. |
| Include the following transaction types |
Select the transaction types you want to appear on the report. |
-
Complete any other settings for the report such as the footer or borders and shading, and then click Save.
Bond Analysis Report
Many of you have asked for fixed income reports for bond analysis. With this release, we've released the Bond Analysis report. This report includes the option to list all fixed income securities with the yield to maturity and modified duration, at cost and at market value.
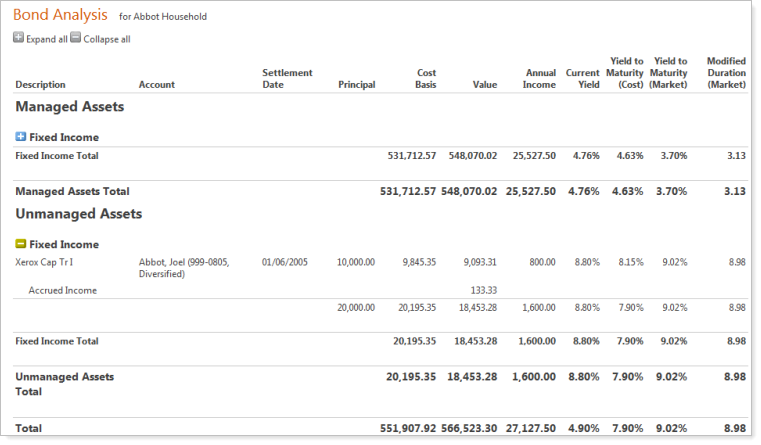
You can view the report as a dynamic report or add it to a PDF template.
Dynamic Bond Analysis Report
To view the dynamic Bond Analysis report, follow these steps:
-
On the Reports menu, click Bond Analysis.
-
Click Edit.
-
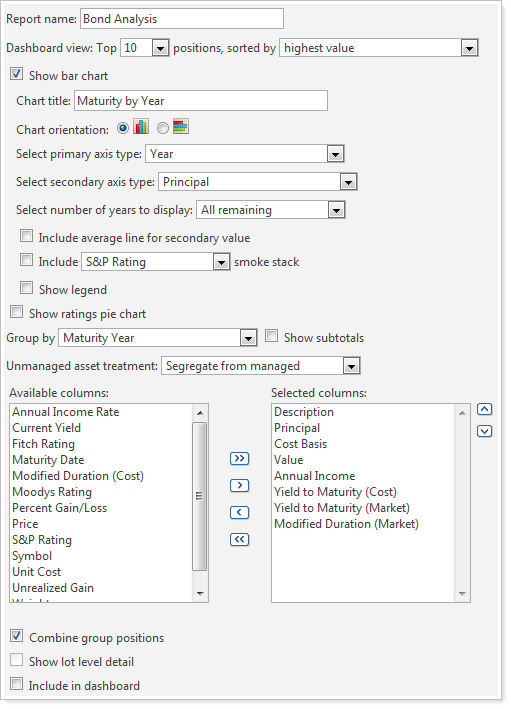
Complete the following information:
| Field | More Information |
|---|---|
| Report name | Type a name for the report. |
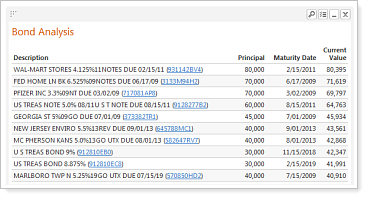
| Dashboard view |
Choose the sorting and number of positions that you want to appear on the report when it's added to the Advisor View dashboard.
|
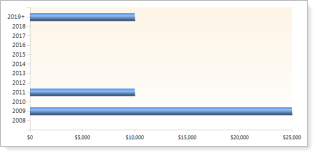
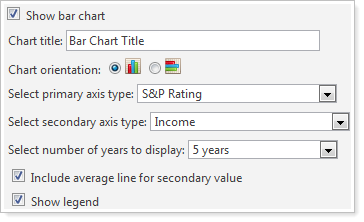
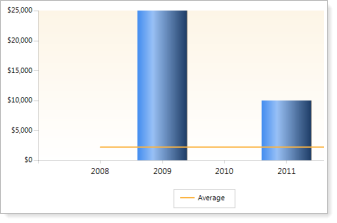
| Show bar chart |
Select this check box if you want to add a bar chart to the report.
When you select this check box, additional configuration options appear.
Select the Show legend check box to add a legend to the bottom of the report. |
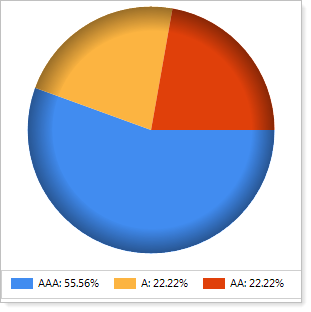
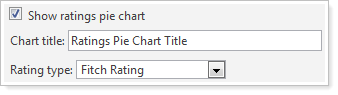
| Show ratings pie chart |
Select this check box if you want a pie chart of the bond ratings to appear on the report.
When you select this check box, additional configuration options appear.
|
| Group by | Choose how you want to group the data on the report. You can group the data on the report by category, cost duration, market duration, or maturity year. |
| Categorize by | If you choose Category in the Group by list, choose the category you want to group the data on the report by. You can choose from security type, asset class, sector, and subsector. |
| Show subtotals | Select this check box to add subtotals to the report for each grouping. |
| Unmanaged asset treatment | Use this list to specify how unmanaged assets are treated. You can choose to omit all unmanaged assets, segregate them in a different section on the Holdings page, or treat them as managed assets. |
| Columns |
Choose the columns you want to appear on the report. |
| Combine group positions |
With this check box, you have the option to view fixed income for each security included in each underlying account, or you can view the fixed income for securities held by more than one underlying account in aggregate for the group.
|
| Show lot level detail | Select this check box if you want to view detailed information about the bonds at the lot level. |
| Include in dashboard | Select this check box if you want to add this report to your Advisor View dashboard. |
-
Click Apply.
Bond Analysis PDF Report
To add a bond analysis section to a PDF report template, follow these steps:
-
On the PDF Templates menu, click Templates.
-
In the Select a template list, choose the PDF template you want to modify. If you haven't created a PDF template, choose Create new template.
-
In the Add a section list, click Bond Analysis, and then click Add.
-
In the Bond Analysis section title box, type a name for the report section.
-
Complete the following information:
| Field | More Information |
|---|---|
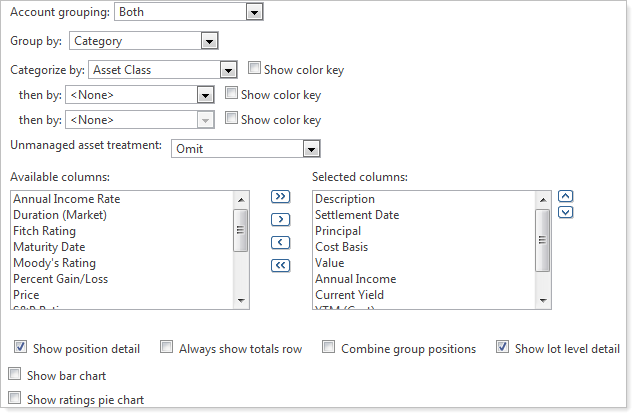
| Account grouping | Use this list to select if you want the individual accounts reported on separately, grouped or both. |
| Group by | Choose how you want to group the data on the report. You can group the data on the report by category, cost duration, market duration, or maturity year. |
| Categorize by | If you choose Category in the Group by list, choose the category you want to group the data on the report by. You can choose from security type, asset class, sector, and subsector. |
| Show color key | Select the color key check box to include the color swatch next to the category name. You can set up these colors by clicking Categories on the Setup menu. |
| Unmanaged asset treatment | Use this list to specify how unmanaged assets are treated. You can choose to omit all unmanaged assets, segregate them in a different section on the Holdings page, or treat them as managed assets. |
| Available/Selected columns |
Choose the columns you want to appear on the report. |
| Show position detail | Check this box to show all securities within each grouping. |
| Always show totals row |
Select this check box to always include a totals row, even if the grouping only includes one security. |
| Combine group positions |
With this check box, you have the option to view fixed income for each security included in each underlying account, or you can view the fixed income for securities held by more than one underlying account in aggregate for the group.
|
| Show lot level detail | Select this check box if you want to see the lot level detail on the report. |
| Show bar chart |
Select this check box if you want to add a bar chart to the report.
When you select this check box, additional configuration options appear.
Select the Show legend check box to add a legend to the bottom of the report. |
| Show ratings pie chart |
Select this check box if you want a pie chart of the bond ratings to appear on the report.
When you select this check box, additional configuration options appear.
|
| Borders and shading |
|
-
Complete any other settings for the report such as the footer or borders and shading, and then click Save.
Customize the Columns on the Transactions Report
When you visit the dynamic Transactions report page in Advisor View, you'll see that you now have the option to customize the columns that appear on the report. You'll also see that we've added the following columns to the report:
-
Commission
-
Unit Commission
![]()
To customize the columns on the report, follow these steps:
-
On the Reports menu, click Transactions.
-
Click Edit.
-
Choose the columns you want to appear on the page:
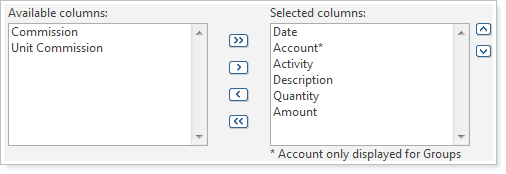
-
To add a column to the report, in the Available columns box, click the column you want to add and then click >.
-
To remove a column from the report, in the Selected columns box, click the column you want to remove and then click <.
-
To add all available columns to the report, click >>.
-
To remove all columns from the report, click <<.
-
Use the ˄ and ˅ buttons to arrange the columns.
-
-
Click Apply.
Position Performance Report Updates
We've made some updates to the Position Performance report.
With this update, you can now:
-
Add position detail to the report
-
Include a subtotal and total row on the report
-
Control the color and borders of the total and subtotal rows
-
Add the following new columns to the PDF template:
Net Contributions
Net Investment Gain
Open Date
Dashboard Summary Report Section Updates
You can now add the column Net Contributions column to the Dashboard Summary section of your PDF reports.