
Contents
Introduction
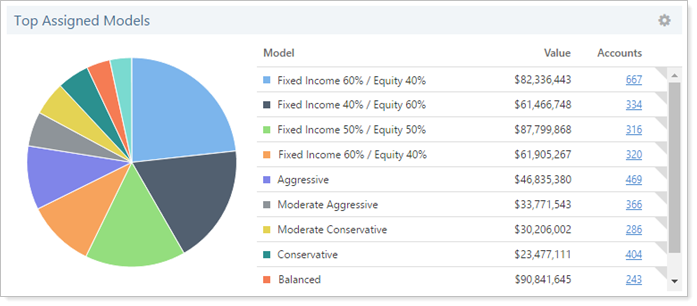
The Models & Categories widget is powerful tool that allows you to look across a wide range of accounts and make decisions based on what you see. The widget shows a pie chart that you can customize to either show model or category data. You can view underlying accounts immediately without navigating away from the dashboard. You can also add and remove columns and set page links to further customize what information you see in the chart.
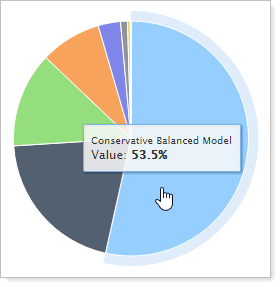
You can interact with the pie chart. Click on a pie piece to view a tooltip showing you value information for that model or category. This also highlights the corresponding information in the table.
Because the widget is customizable, you can use the Models & Categories widget as a heads-up display showing items that need to be done. For example, you can sort the chart to show the most deviated models and take action on accounts assigned to that model.
Filtering
Filtering at the top of the dashboard shows a summary of information for your accounts in Tamarac Trading.

The account filters and account set/working list selections apply to account-related widgets.
You can filter the information you see within account-related widgets in the following ways:
-
Saved Search.Filter the results in account-related widgets by applying a saved search which will show only the data from the accounts in that saved search. To do this, select the appropriate saved search from the list, and select Filter. To let you see your entire list of Saved Searches, the Saved Search filter will not apply to the Saved Searches widget on the Trading dashboard.
-
Account Set or Working List.Filter the results in account-related widgets by applying an account set filter to only show data from the accounts in that account set or working list. To do this, select the appropriate entity in the Select an account set or working list list, and click Filter.
-
Reset.Click the Reset button to remove any filtering applied to each of the account-related widgets. The widgets will then reset to include data from all accounts.
Underlying Accounts
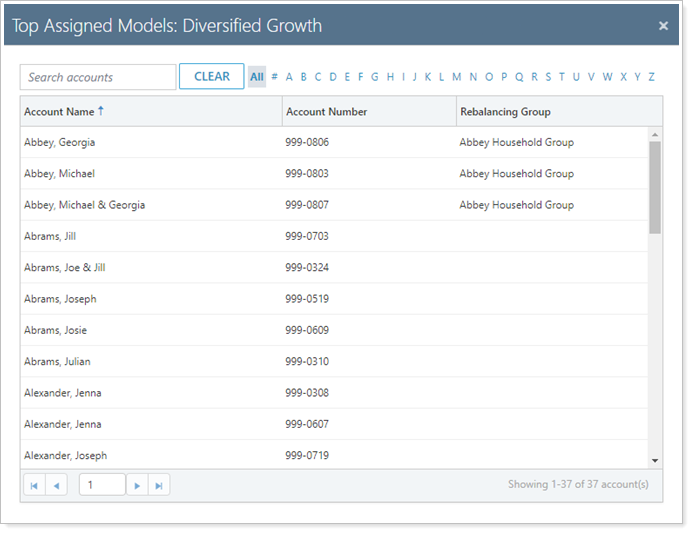
You can view the underlying accounts immediately without having to navigate away from the Dashboard. To view these accounts, click Accounts quick view  within the widget. This opens a dialog box showing the accounts associated with that model or category.
Customize
You can customize the information you see on the Models & Categories widget in the following ways.
Change the Display Name
To change how the name that appears on the widget, follow these steps:
-
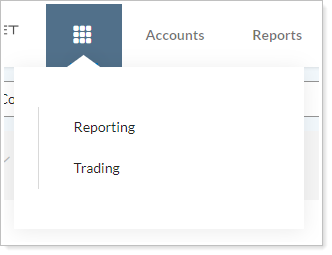
From your Home menu, select Trading.
-
Select Edit
 to open settings for the Models & Categories widget.
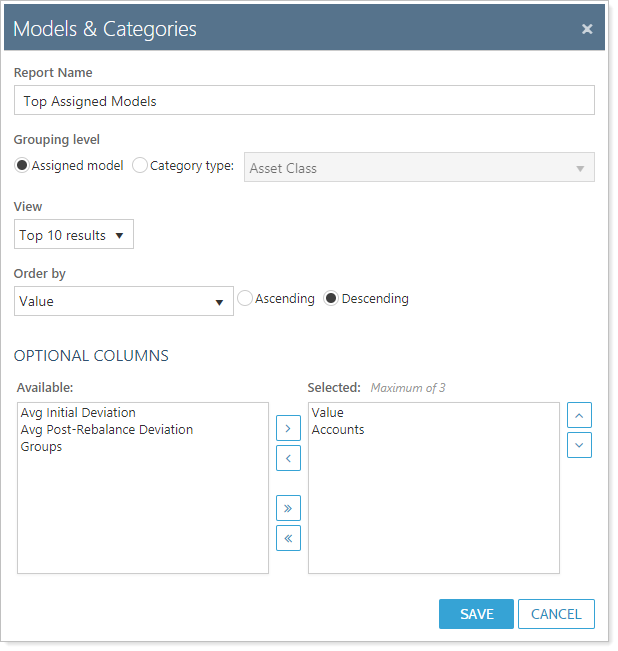
-
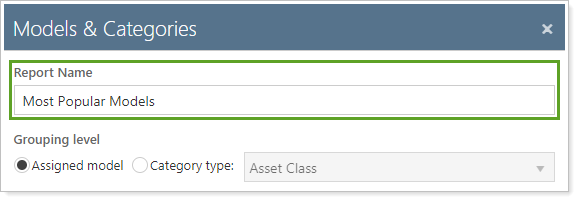
In Report Name, type the appropriate display name. You can use up to 128 characters.
-
Select Save.
Change Your Viewing Options
To change the way the Models & Categories widget is grouped and sorted, follow these steps:
-
From your Home menu, select Trading.
-
Select Edit
to open settings for the Models & Categories widget.
-
Change Grouping level to your preferred method of grouping. This option determines the data you will see on the widget.
Option More Information Assigned model This groups all data you see by models assigned to your accounts Category type This groups all data you see by security category -
Change your View option to either show Top 10 or Top 20 results.
-
In the Order by list, choose the criteria which you 'd like to sort your chart against. For example, choosing Accounts sorts your model or category results by the number of accounts that applies.
-
Choose either Ascending or Descending to sort your results.
-
Select Save.
Add or Remove Columns from the Widget
To change the visible columns, follow these steps:
-
From your Home menu, select Trading.
-
Select Edit
to open settings for the Models & Categories widget.
-
In the Optional Columns section, choose the appropriate column.
Column More Information Accounts The number of accounts associated with that model or category. Avg Initial Deviation The initial deviation for that model or category as the sum of the initial deviation divided by the number of accounts or groups. Avg Post-Rebalance Deviation The post-rebalance deviation for that model or category as the sum of the post-rebalance deviation divided by the number of accounts and groups. Groups The number of groups associated with that model or category. Value The sum of the allocated value for that model or category. -
To add a column, click
 to add it to the Selected list. You can add up to 3 columns.
 -
To remove a column, click
 to add it to the Available list.
 -
To reorder the columns, click
 to move the column up or
  to move the column down.
-
-
Select Save.