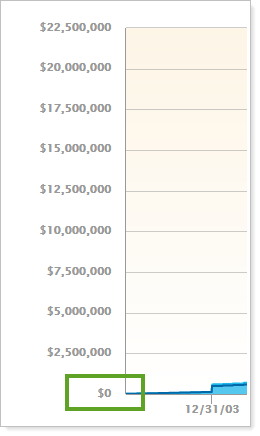
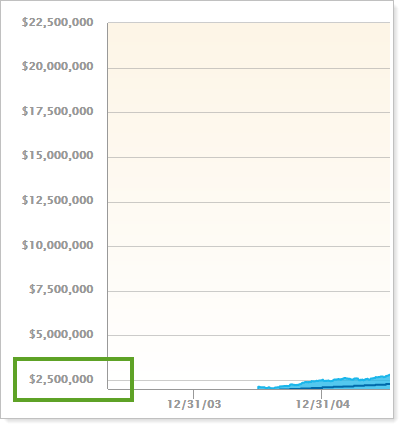
This report setting lets you set the where the y axis starts on the Capital Flows chart. On the chart, the y axis shows dollars.
You might choose to do this if the account already had value at the beginning of the period and you don't need to show flows around the $0.00.

For example, with Customize y-axis starting value cleared, you see:

With Customize y-axis starting value selected and set to $2,000,000, you see:

This setting applies to the Capital Flows report.
