
Contents
Introduction
| Applies to: | |||
|---|---|---|---|
| ✔ Dynamic | Mobile | ✔ Client Portal | |
The Capital Flows report brings together transactions and performance data to allow you to show clients an account or group's contributions and withdrawals over a specified time period. It also helps you understand and troubleshoot IRR for an account or group.
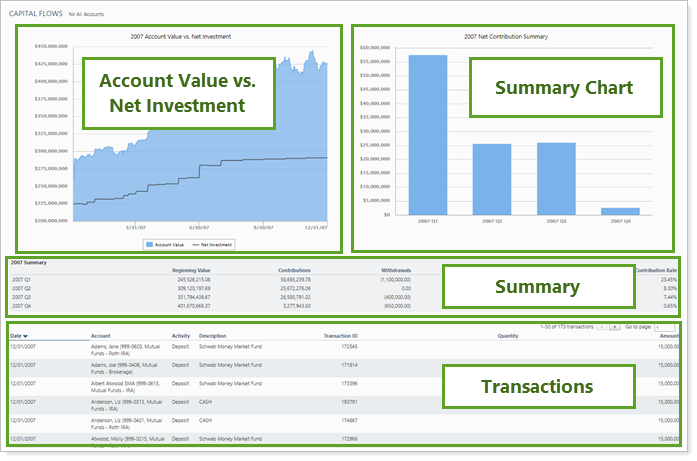
Within the report, you can include any of four components:
-
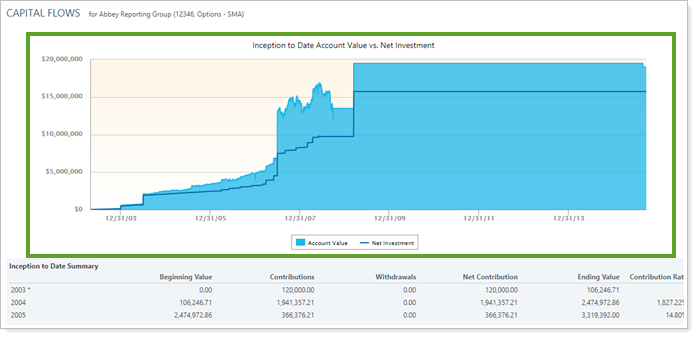
Account Value vs. net Investment A chart comparing the account value with the net investment.
In PDF reports, this chart is sampled at the following rates:
- When plotting 0 to 10 years on the x axis: Sampled every 1 day
- When plotting 10 to 20 years on the x axis: Sampled every 7 days
- When plotting 20+ years on the x axis: Sampled every 30 days
-
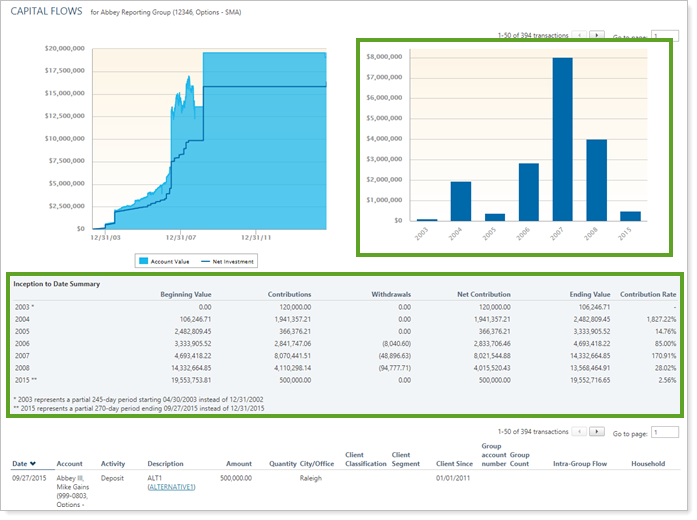
Summary Chart A chart summarizing contributions by net contribution or contribution rate.
-
Summary A more detailed summary table with a set array of columns.
-
Transactions A very detailed table listing all applicable transactions.
For both managed and unmanaged assets, this report can show:
-
Deposits
-
Withdrawals
-
Receipts
-
Transfers
TIP
Many users find it convenient to create a report view for small capital flows and another for large capital flows.
Why Use the Capital Flows Report?
In the Capital Flows report, you will find versatile sorting and charting options that let you answer many flow-related questions, such as:
-
How does My Client's Net Investment Compare with the Account Value?The account value vs. net contribution chart provides a clear comparison of the account value change over time with contributions over that same period. Toggle the net contribution line on and off as appropriate, depending on whether you're looking at managed and unmanaged assets.
-
How Much has My Client Contributed or Withdrawn This Year?The contribution summary table clearly delineates contributions, withdrawals, and net contributions, as well as showing the impact on account value and reporting the contribution rate for each period.
-
What are trends in the contribution rate over time?The net contribution summary bar chart makes it easy to see at a glance what a client's contribution rate or amount has been over the period. You can choose to see contributions broken out by week, month, quarter, or annual intervals within the date period.
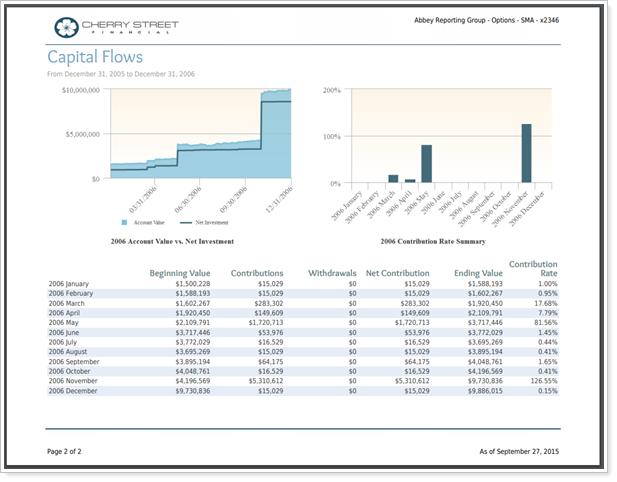
See the Capital Flows Report in Action: In a PDF Template
In their year-end report, Cherry Street Financial provides an overview of the contributions and withdrawals for that year, broken down by month. However, they prefer to keep the report length down, so they exclude transaction details, instead including the summary charts and table.
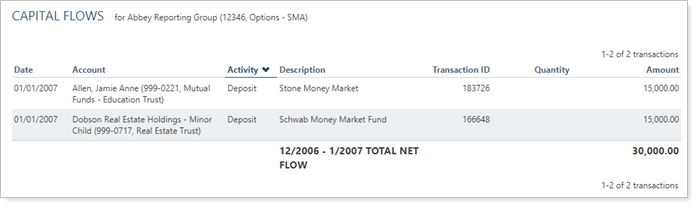
See the Capital Flows Report in Action: As a Dynamic Report
An advisor can't remember whether a client made a $15,000 contribution to her account in December 2006 or January 2007. The advisor sets up a capital flows report with a custom date period of 12/1/2006 to 1/31/2007, then uses the Show only flows where... option to show only flows where the dollar amount is equal to $15,000. By includes only the transactions portion of the report, the advisor quickly determines that the contribution was made on January 1, 2007.
Features of the Capital Flows Report
The dynamic Capital Flows report helps you easily filter and sort data to drill down to meaningful results. Interactive reporting features include the following.
Include Only the Sections You Need
Directly compare net investment with account value with an optional chart that displays the net investment alongside the account's value. For unmanaged assets, you can even choose to show or hide the net investment.
As part of the ability to customize sections, you can include sections that summarize capital flows in an optional chart, in an optional table, or in both. You cannot customize column included on the Summary table.
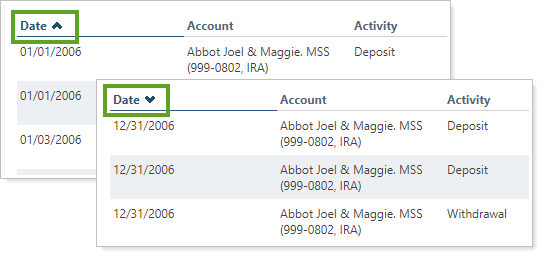
Sort Columns on the Fly
Sort columns by clicking column headers in the transactions section. The caret direction (^ or ˅) indicates sorting order, either ascending or descending.
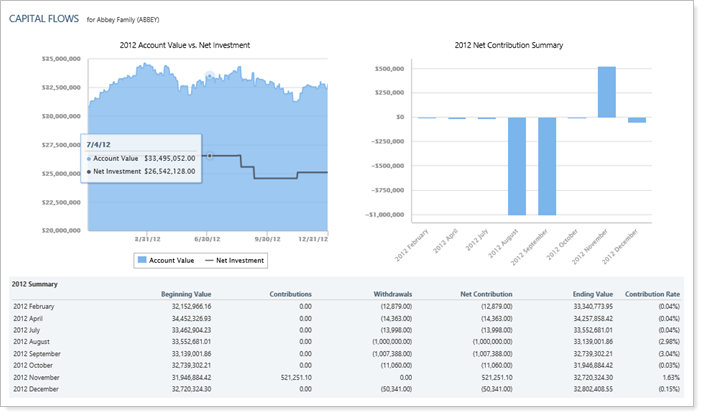
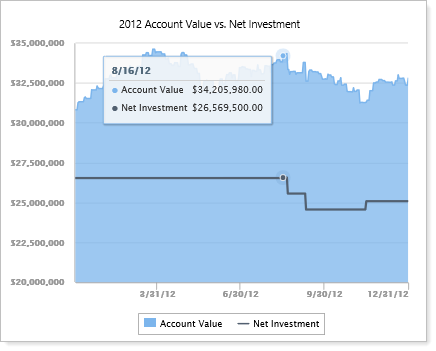
Use Tooltips to See Details
See data details by hovering over a category on the bar or line chart—you will see a tooltip display.
Customize Data Displayed
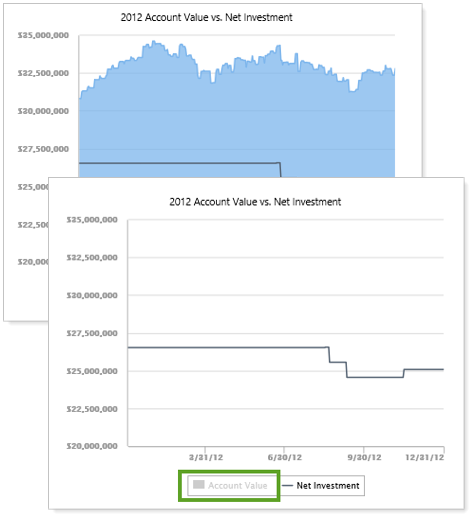
Click data points in the chart legend to show or hide data points.
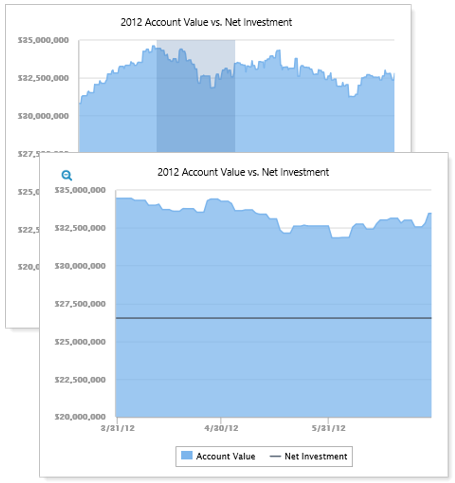
Zoom In or Out to Change the View
Zoom in by clicking and dragging to select an area. You can then scroll through the zoomed area by holding down the Shift key and dragging to the left or right. Reset your zoomed chart quickly by clicking the  button
Include Managed and Unmanaged Assets
Display managed, unmanaged, and total side by side.
For more information about marking securities as unmanaged and how reports display unmanaged assets, see:
- How Reports Handle Unmanaged Assets
- Exclude Cash or Other Securities from Performance
- Exclude From Performance/Exclude ALL Securities From Performance
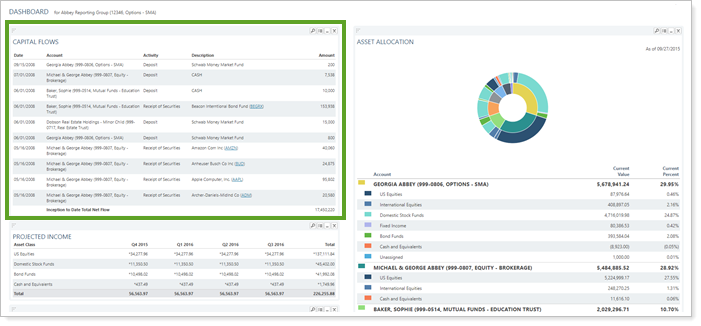
Add Capital Flows to the Reporting Dashboard
You can use dashboard views to see a pared-down summary of the main dynamic report at a glance on your dashboard. This can be useful to help you identify large flows that occurred that day, for example.
To learn more about creating and managing dashboard views, see Create and Share Dashboard Views.
For more information on customizing your dashboard, visit Working With Dashboard Modules.
Capital Flows Report Settings
The following settings are available for the Capital Flows report. Click the setting name for more details.
| Setting | Details | Available In... | |||
|---|---|---|---|---|---|
| Dynamic Report | PDF Report | Reporting Dashboard | PDF Dashboard |
||
| Report Name | Designate a unique name for the report view. | X | X | ||
| Mark as Publicly Accessible | Share the report view. | X | X | ||
| Section Title | Designate what the section will be called in the PDF report. | X | |||
| Theme | Designate what theme the section will use. | X | |||
| Header and Footer | Choose a unique header and footer for the section or use defaults. | X | |||
| Include Page Break After This Section |
Control where page breaks occur in PDF reports. |
X | |||
| Account Grouping | Control grouping of accounts and groups. | X | |||
| Select the date period you want to use for the report. | X | X | X | ||
| Include Intra-Group Flows | Include or exclude intra-group flows. | X | X | X | |
| Include Expenses that Do Not Reduce Gross/Net Performance | Include or exclude expenses based on how their expense types are designated. | X | X | X | X |
| Report on Managed/Unmanaged Assets |
Include or exclude managed and unmanaged assets. |
X | X | X | X |
| Show Account Value vs. Net Investment Chart |
Display or hide the Account Value vs. Net Investment chart. |
X | X | X | X |
| Customize Y-Axis Starting Value | Set the where the y axis starts on the account value vs. net investment chart. | X | X | X | X |
| Include Net Investment | Show or hide the net investment line on the account value vs. net investment chart. | X | X | X | X |
| Show Summary |
Display or hide a summary table. |
X | X | X | X |
| Include Date Periods With No Flows | On the summary table, display all date periods, regardless of flows. | X | X | X | X |
| Show Summary Chart Based On |
Display or hide a bar chart that summarizes flows and modify settings. In the PDF Dashboard Capital Flows report, you add a summary chart by selecting Summary Chart from the Show list. |
X | X | X | X |
| Group Summary Data By | Designate how to group the summary data in the summary chart. | X | X | X | X |
| Show Transactions |
Display or hide a table of transactions. |
X | X | X | |
| Set how many records are displayed per page of the dynamic report. | X | ||||
| Combine Transfer Lots | Combine lots up into one transfer record, or break out each lot as individual transactions. | X | X | ||
| Show Only Flows Where | Filter the transactions table by size of transaction, either dollar amount or percentage of account size. | X | X | X | |
| Available/Selected Columns | Choose which columns are included, in what order. | X | X | ||
| Top Custom Text | Add custom text to the top of the report section. | X | |||
| Top Text Alignment | Set alignment of the top custom text. | X | |||
| Bottom Custom Text | Add custom text to the bottom of the report section. | X | |||
| Bottom Text Alignment | Set alignment of the bottom custom text. | X | |||
| Show Transactions/Summary Data, With the Chart For |
Configure the Capital Flows dashboard report sections. Includes related setting:
|
X | |||
Report Actions
To learn more about reports in Tamarac, see Introduction to Reports.
To learn more about how to generate a report, change the data displayed, print or export the report data, and more, see Basics of Working With Reports.
To learn more about creating and using PDF reports, see Understanding PDF Reports and Workflow: Generate a PDF Report.