 Back
Back|
Back |
|
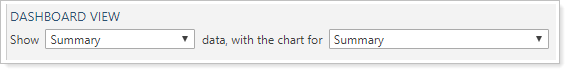
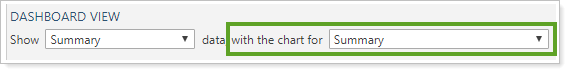
Show Transactions/Summary Data, With the Chart For
|
How Show Transactions/Summary Data, With the Chart For Works |
| Applies to: | ||
|---|---|---|
| ✔ Dynamic |
Client Portal |
|
These settings allow you to designate how the capital flows data are displayed on the Capital Flows dashboard report. The dashboard report sections have all the same settings as the selected section in the Capital Flows report.
You would choose to use the Capital Flows dashboard report if you're looking for quick, at-a-glance access to specific information about flows.
To learn more about dashboard reports, see Learn More About the Reporting Dashboard.
The Capital Flows dashboard includes two different sections you can display: a data table and a chart.
Select an option from the Show ___ Data to include a capital flows data table on the dashboard report.
Select an option from the ...with the chart for to include a capital flows chart on the dashboard report.
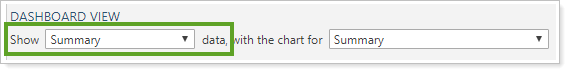
The Show ___ Data list allows you to show or hide a data table, and to set what data the table displays. This list is based on the sections added to the dynamic Capital Flows report that the dashboard is based on. If your dynamic report is only set to display one of these table types, only that type will be available in the list.
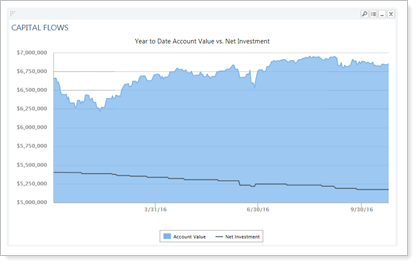
To show no table, choose <None>. If you set the Show list to <None>, you must choose a chart. Only the chart selected is displayed.
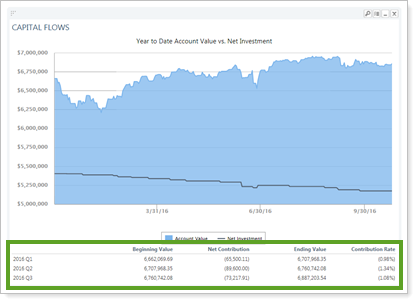
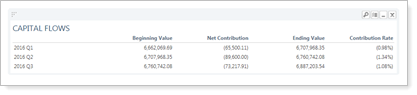
To show a Summary table, choose Summary. The Summary table uses the same settings as the Summary table on the dynamic report.
The Summary table from the dynamic report is displayed, using the dynamic report settings.
To show a Transactions table, choose Transactions. The Transactions table uses the same settings as the Transactions table on the dynamic report. The Transactions table from the dynamic report is displayed, using the dynamic report settings.
![]()
The With the chart for list allows you to show a chart and set what data the chart displays. This list is based on the sections added to the dynamic Capital Flows report that the dashboard is based on. If your dynamic report is only set to display one of these chart types, only that chart will be available in the list.
To show no chart, choose <None>. If you set the With chart for list to <None>, you must choose a data table. Only the data table selected is displayed.
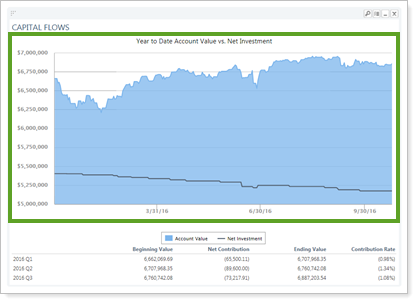
To show an Account Value vs. Net Investment chart, choose Account Value vs. Net Investment. It uses the same settings as the Account Value vs. Net Investment chart on the dynamic report.
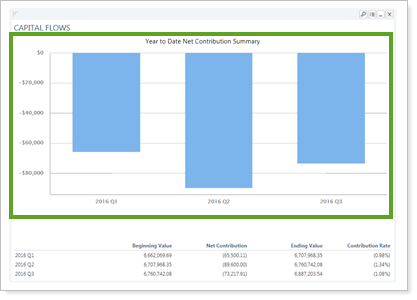
To show a Contribution Rate Summary chart, choose Summary. It uses the same settings as the Contribution Rate Summary chart on the dynamic report.
This setting is not available for PDF reports.
The following setting interacts with this option: