
Contents
How Show Summary Works
| Applies to: | ||
|---|---|---|
| ✔ Dynamic |
✔ Client Portal |
|
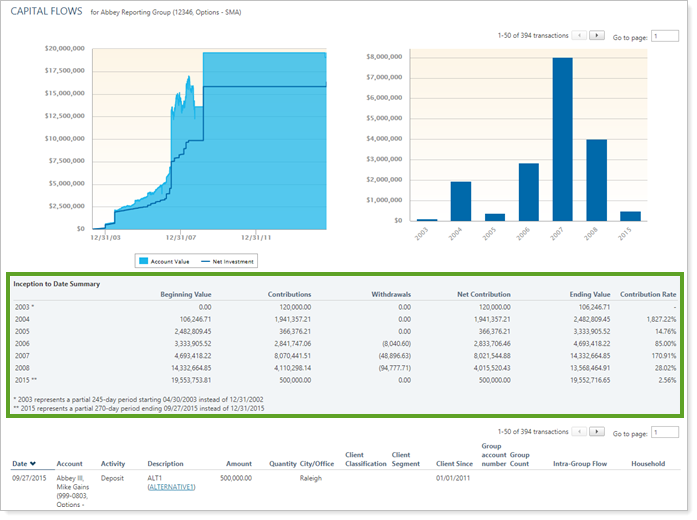
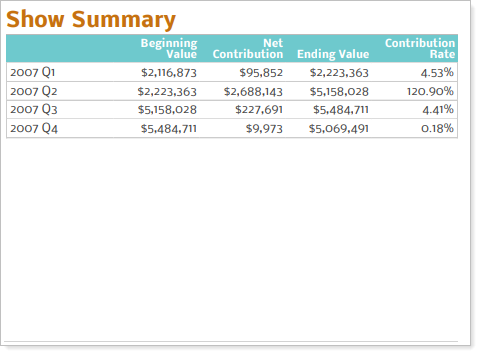
This setting allows you to include a summary table on the Capital Flows report that displays the following data:
-
Year
-
Beginning Value
-
Contributions
-
Withdrawals
-
Net Contribution
-
Ending Value
-
Contribution Rate
The columns displayed and column order are not customizable.
This table is useful for seeing net contribution, allowing you to review with end clients when investments and withdrawals were made and effect that those had. For example, when working with clients in retirement who are taking regular withdrawals, you can use this to evaluate the impact of those withdrawals.
Important
A maximum of 52 groupings will be shown in the Summary. If your summary data includes more than 52 groupings, the Summary section will not be displayed.
In Dynamic Reports
-
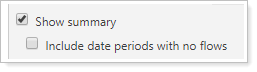
To hide the summary table, clear Show summary.
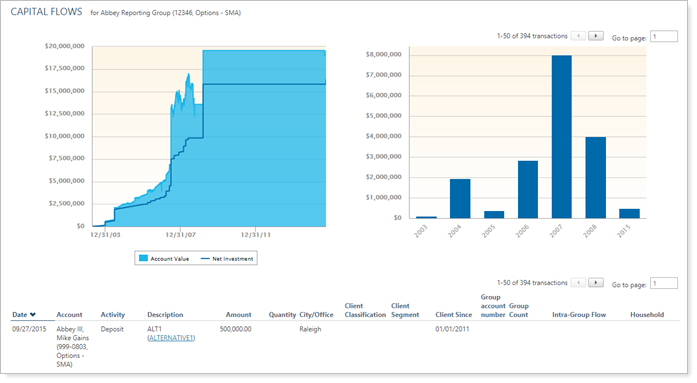
If you chose to add charts, charts are displayed above the transactions table. If you omitted charts, only the transaction table is displayed.
-
To see the summary table, select Show summary.
Depending on what charts you choose to include, the summary appears either between the charts and the transaction table, or just at the top of the page above the transaction table.
When you select the Show summary check box on the Capital Flows report, the you can choose to Include Date Period With No Flows.
In PDF Reports
Full PDF Report Section
Functionality is the same in the full PDF report template as in dynamic reports.
PDF Dashboard Section
When you add the Capital Flows report to one of the PDF Dashboard panels, you can choose to add one of the three Capital Flows sections to the panel. The options are:
-
Account Value vs. Net Investment Chart
-
Summary
-
Summary Chart
For more information on the account value vs. net investment chart or summary chart, see Show Account Value vs. Net Investment Chart and Show Summary Chart Based On.
-
To add a summary table to the PDF Dashboard panel, click Summary in the Show list.
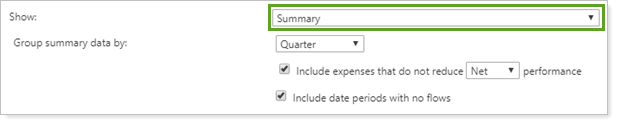
When you add the summary table, the following additional settings are available: