 Back
Back Home > Tamarac Reporting > PDF Reports > Create Edit or Delete PDF Report Components > PDF Dashboard Report
|
Back |
Home > Tamarac Reporting > PDF Reports > Create Edit or Delete PDF Report Components > PDF Dashboard Report
|
PDF Dashboard Report
|
See the PDF Dashboard Report in Action Choose Your Section Configuration See a Preview of Your Dashboard Include Custom Graphics or Text Create, Edit, or Delete a PDF Dashboard Section |
| Applies to: | |||
|---|---|---|---|
| Dynamic | Mobile |
Client Portal |
|
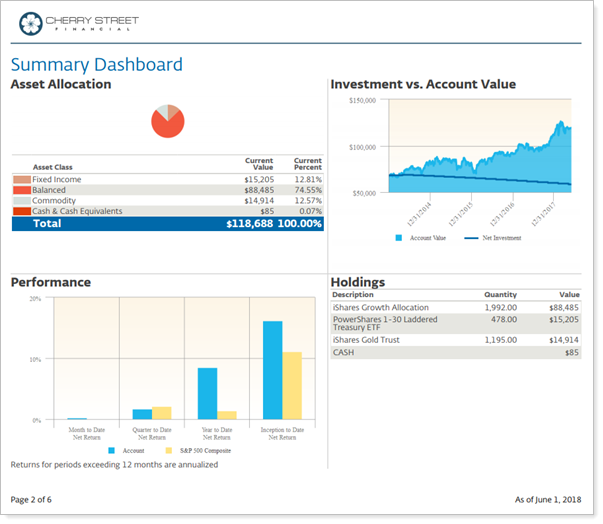
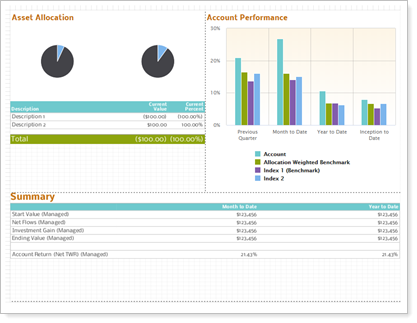
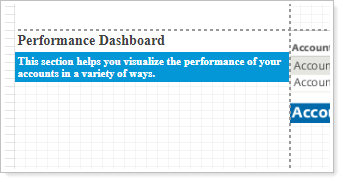
The PDF Dashboard section provides two, three, or four customizable panels on a page that each provide a snapshot of a full report. It is frequently used as an introduction to PDF reports, showing an overview of results the client will see detailed in the rest of the report.
Using the PDF dashboard, you can provide multiple levels of detail in a report:
Very high level, provided by the summary dashboard at the beginning of the whole report.
More focused summary, provided by the dashboard at the beginning of each different section.
Very detailed, provided by the specific performance, transactions, or holdings reports.
A PDF dashboard includes two to four customizable panels. You can add any of the following reports to a PDF dashboard panel:
This topic provides information about why you might use a PDF dashboard section and what settings you'll find there. For details on how to use or manage PDF dashboard panels, see Manage Panels on the PDF Dashboard.
The PDF dashboard displays up to four areas of unique content on a page, allowing you to answer such questions as:
What are Key Metrics I want Clients to Absorb? Use the PDF dashboard to highlight the most important take-away information you want to communicate to clients. For example, if you want to emphasize the impact of your investment strategy on performance, the PDF dashboard may feature an emphasis on asset allocation over time and performance.
Holdings Questions: How is the portfolio allocated by category? What are details of the portfolio's holdings? What would be the impact of selling a holding? What is the Household's overall net worth?
Performance Questions: How did the portfolio perform over time? How did performance by category compare with indexes or benchmarks? What impact did flows have on performance?
Transaction Questions:When did flows occur? What income was received and what income is anticipated? What were the realized gains for transactions?
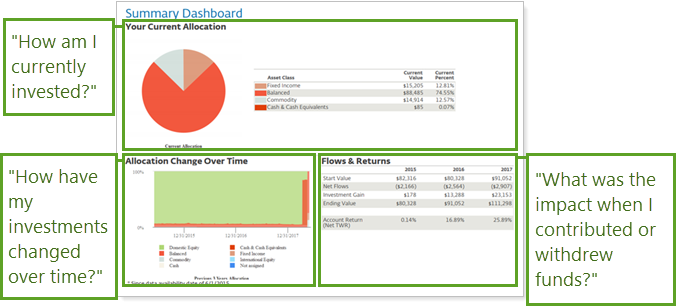
An advisor wants to make sure that her clients understand what they're invested in and how they got there. To help clients take away the key information, the advisor has designed a PDF dashboard that focuses on allocation and flows.
Their dashboard helps clients focus on and answer the following questions:
How am I currently invested?
How have my investments changed over time?
What was the impact when I contributed or withdrew funds?
The PDF Dashboard section includes the following features.
Select from among a number of configurations to find the perfect one for your needs.
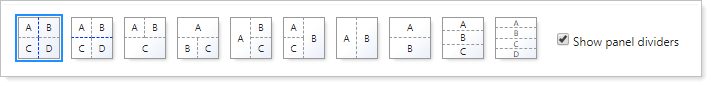
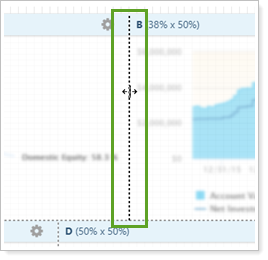
Drag and drop borders to create sections that are the precise dimensions you want.
When resizing sections, remember that different account data will result in differently displayed results. Run sample reports to ensure charts and tables fit in resized sections for accounts with long names or large balances.
The dashboard builder gives you a quick preview of what each panel will look like based on your theme and setting configuration choices.
Previews on the dashboard are for general representation and placement. Not all of the selected report settings will be displayed. For example, the preview may display benchmarks and indexes differently from how they actually look when you run the report.
Enhance your branding and provide explanations when you add custom graphics or text as section content. For more information, see PDF Custom Section: Add, Edit, and Delete Custom Graphics and PDF Custom Section: Add, Edit, and Delete Custom Text.
Choose from among a wide variety of performance, holdings, and transactions reports to create a dashboard that includes the appropriate data for the report.
For information on how to create and manage a PDF Dashboard section, see Create, Edit, or Delete a PDF Dashboard Section.
There is no PDF Dashboard dashboard widget available for the reporting dashboard because the report is only available as a PDF section.
The following settings are available for the PDF Dashboard. Click the setting name for more details:
| Setting | Details | Available In... |
|---|---|---|
| PDF Report | ||
| Section Title | Designate what the section will be called in the PDF report. | X |
| Theme | Designate what theme the section will use. | X |
| Header and Footer | Choose a unique header and footer for the section or use defaults. | X |
| Account Grouping | Control grouping of accounts and groups. | X |
| Include Reports for Closed Accounts | Choose to show sections for accounts that were closed before the report as-of date. | X |
| Partial Returns |
Choose how to mark data points that have partial returns. Includes related setting:
|
X |
| Show Actual Return Dates | Show the actual start date for partial period returns. | X |
| Layout | Set the basic panel configuration. | X |
| Show Panel Dividers | Show or hide dividing lines between panels. | X |
To learn more about reports in Tamarac, see Introduction to Reports.
To learn more about how to generate a report, change the data displayed, print or export the report data, and more, see Basics of Working With Reports.
To learn more about creating and using PDF reports, see Understanding PDF Reports and Workflow: Generate a PDF Report.