
Contents
Introduction
| Applies to: | |||
|---|---|---|---|
| ✔ Dynamic | ✔ Mobile | ✔ Client Portal | |
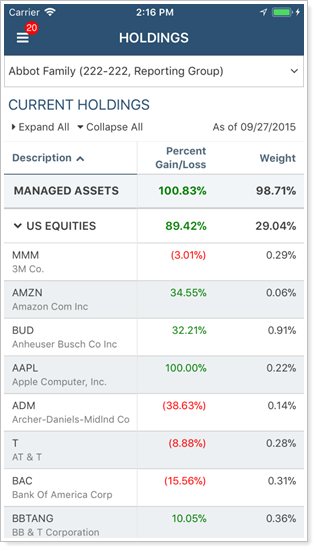
The Holdings report displays a table of the holdings in an account or group, including up to three different grouping levels with subtotals. The report allows you to choose columns from a variety of data points and their order in the report, as well as filter for specific securities, include or exclude categories, and custom display SMAs and positions. You can also set custom column widths for this report and preview it to determine if the data fits as expected.
The Holdings report is useful for organizing and drilling into very detailed holdings data.
Why Use the Holdings Report?
In the Holdings report, you will find detailed data reporting options that let you answer many holdings-related questions about accounts and groups, such as:
-
How is this account currently invested? Evaluate the holdings in accounts or groups by category, such as asset class or security type.
-
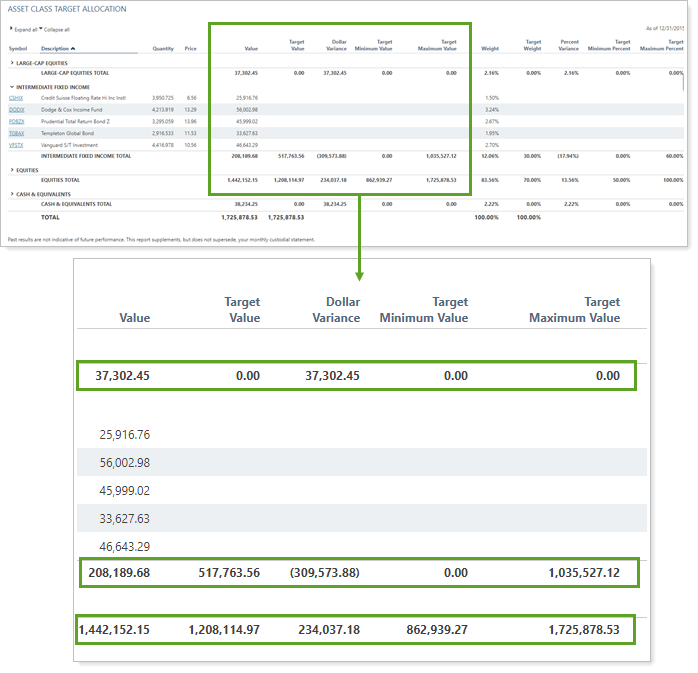
How do current holdings compare with target allocation?Compare actual and target position-level allocations, including target value and weight, dollar and percent variance, and minimum and maximum target value and percent.
-
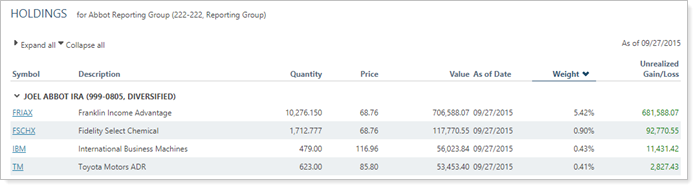
What Weight or Value did a Specific Category or Asset Have on a certain day?Review a snapshot of holdings on a specific date, with dynamic reporting options that let you flexibly sort results on the fly.
-
What are the holdings details of a specific security?The Holdings report allows you to view data points that are relevant only for a particular security type, and then filter to see only that security type. For example, you could create a report that displays interest rate, maturity date, and bond rating—data points only relevant to fixed income—and then filter to see only fixed income. Then you could have a second Holdings report view that looks at equity-specific details such as quantity, price, and cost basis.
See the Holdings Report in Action: Portfolio Analysis
A client has established a 529 educational account to pay for their child's education. The advisor created a target allocation for the 529 account to help keep the account on track.
When it's time to review the 529 account's allocation, the advisor uses a Holdings report that displays positions by asset class, then adds current value and weight and several value and weight target allocation columns. Then the advisor can compare the current value and weight of particular categories with the target value, see the places they differ and what holdings are in each category, and adjust accordingly.
See the Holdings Report in Action: Sector Analysis
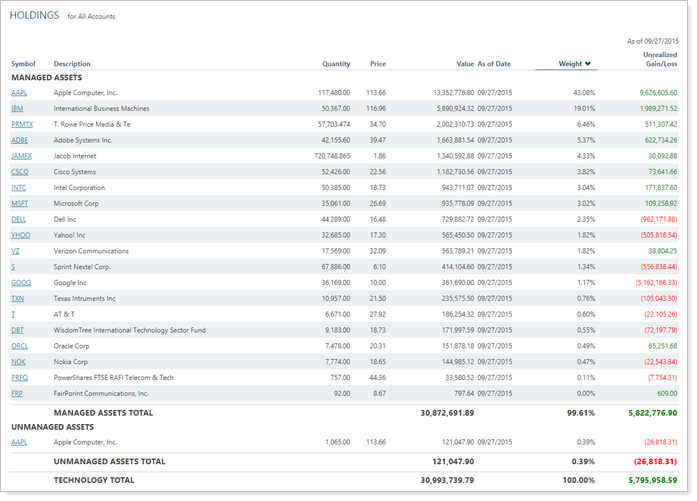
An advisor wants to evaluate all the technology sector assets in several high net worth portfolios he manages. He's concerned about the performance of a specific company and wants to make sure none of his portfolios hold that security.
He creates a Holdings report that includes only assets in the Sector classified as Technology and he includes unmanaged assets, since he wants to make sure to alert clients even if he's not responsible for those accounts. Then he runs the Holdings report on the group of high net worth portfolios and confirms that none of them hold the security he's concerned about.
Features of the Holdings Report
In the Holdings report, you have granular control over what you see to help you easily identify and evaluate results. Interactive reporting features include the following.
Compare Current and Target Allocation Value and Weight
Add any of the following target allocation columns to the report to see category-level target values, weights, and differences:
- Dollar Variance
- Percent Variance
- Target Value
- Target Maximum Percent
- Target Minimum Percent
- Target Maximum Value
- Target Minimum Value
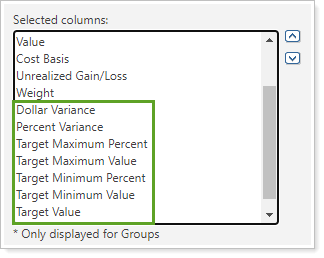
For more information, see Add Target Allocation to the Holdings Report.
Customize the Data and Display
Display only relevant data. You control what data are displayed and which columns are included, in what order, so you can create the exact report you need.
Filter the Report Data
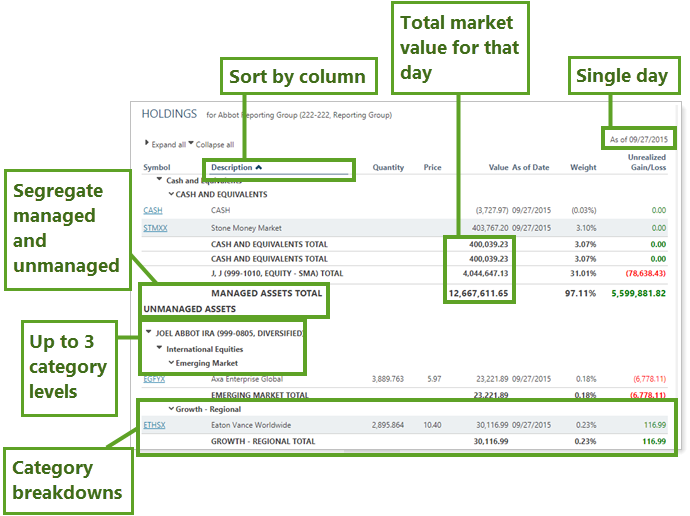
Powerful filtering lets you see only relevant data points for the designated securities. Control how much detail you see—anything from each position held in all the accounts within a group, to a broad, group-wide holdings summary.
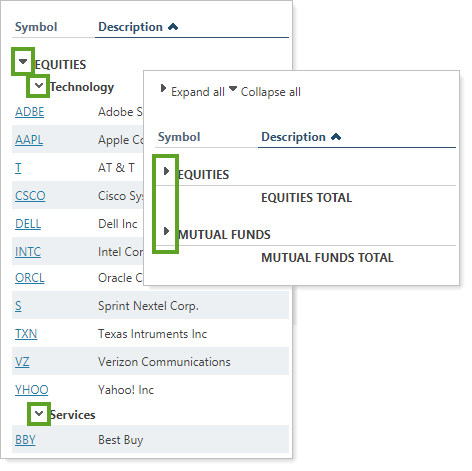
Expand or Collapse Rows
Expand (>) or collapse (˅) table rows to further control the level of detail.
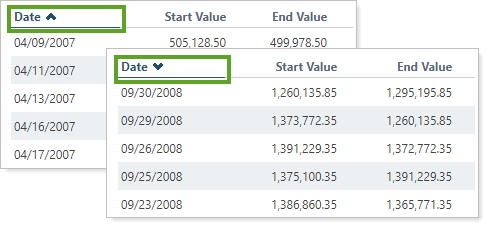
Sort Columns on the Fly
Sort columns by clicking column headers. The caret direction indicates sorting order, either ascending or descending.
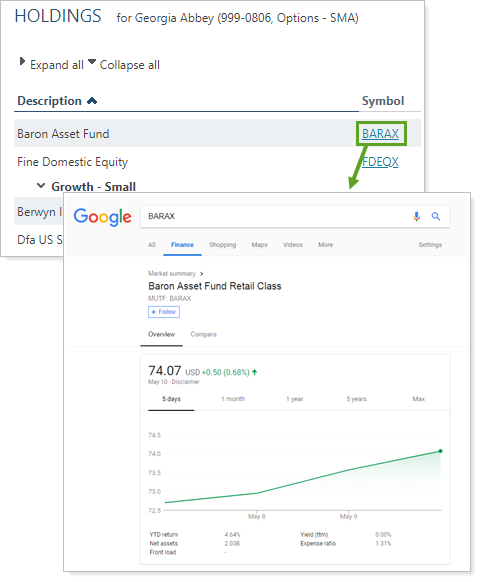
View Security Details
Click the name of a security to view Google Finance information about that security.
You can enable or disable ticker links for each security type.
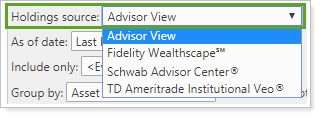
Set the Data Source
You can choose the data source: Either the custodian or Advisor View. If you choose Advisor View, the data could come from your portfolio accounting system, or from the custodian. To learn more about setting the data source, see Holdings Source.
Share on the Mobile App
The report is optimized for mobile viewing, making it easy to use on any device, anywhere. To learn more about mobile app report features, see Mobile App Reports.
Customize Naming
You can customize the name of most selected columns and the Managed/Unmanaged labels used for the headings and captions.
Add Holdings to the Reporting Dashboard
You can use dashboard views to see a pared-down, at-a-glance summary of the main dynamic report on your dashboard.
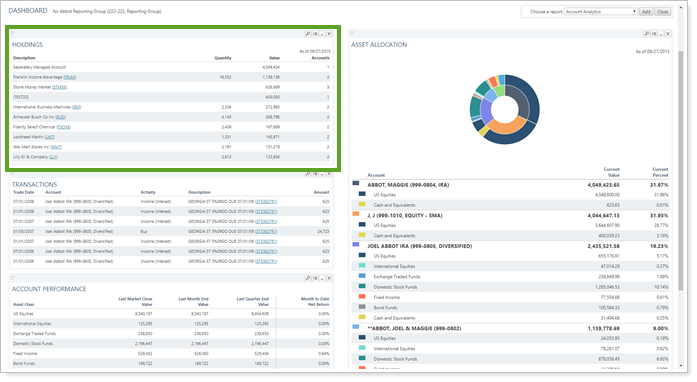
To learn more about creating and managing dashboard views in general, see Create and Share Dashboard Views.
For more information on customizing your dashboard, visit Working With Dashboard Modules.
Holdings Report Settings
The following settings are available for the Holdings report. Click the setting name for more details:
| Setting | Details | Available In... | |||
|---|---|---|---|---|---|
| Dynamic Report | PDF Report | Reporting Dashboard | PDF Dashboard |
||
| Report Name | Designate a unique name for the report view. | X | X | ||
| Mark as Publicly Accessible | Share the report view. | X | |||
| Section Title | Designate what the section will be called in the PDF report. | X | X | ||
| Theme | Designate what theme the section will use. | X | |||
| Header and Footer | Choose a unique header and footer for the section or use defaults. | X | |||
| Include Page Break After This Section |
Control where page breaks occur in PDF reports. |
X | |||
| Account Grouping | Control grouping of accounts and groups. | X | |||
| Holdings Source |
If you bring in data from Schwab, Fidelity, TD Ameritrade, or other custodians, you can choose to display their data or the data from Tamarac. |
X | |||
| As of Date | Select the date you want to use for the report. | X | X | ||
| Use Intraday Pricing | See 15 minute delayed pricing for securities within Tamarac reports. | X | X | ||
| Include Only | Filter the holdings displayed by category. | X | X | X | X |
| Group By/Then By |
Organize a report by various categories. |
X | X | X | |
| Show Subtotals |
Add subtotals to each grouping level when you Group by. |
X | X | ||
| Sort First By/Then By |
Determine the default order in which the data is displayed. |
X | X | X | |
| Include Unmanaged Assets |
Specify how unmanaged assets are treated in the report. |
X | X | X | |
| Unmanaged Asset Treatment |
Choose how you want to treat unmanaged assets on the report. For more information about marking securities as unmanaged and how reports display unmanaged assets, see: |
X | X | ||
| Show Position Detail |
Show or hide underlying positions that make up subtotals. |
X | X | ||
| Report Direct Member Groups as a Single Line Item |
Show or hide all the direct members of groups within a group. |
X | |||
| Always Show Totals Row | Include a totals row for every section. | X | |||
| Position Display Option | Designate how individual positions are shown on the report. | X | |||
| Combine Group Positions | Combine any common positions that are held within a selected group. | X | |||
| Show Lot Level Detail | View detailed information about the holdings at the trade lot level. | X | |||
| Use Multiple Security Categories | Choose whether to display securities by primary category or by multiple categories where applicable. | X | X | X | X |
| Report SMAs as a Single Line Item | Choose how you want to see SMAs in the report. | X | X | X | |
| Report Security Groups as a Single Line Item | View security groups at the group level or in a detailed breakout. | X | X | ||
| Available/Selected Columns | Choose which columns are included, in what order. | X | X | X | |
| Show Change For | Set the date range for columns that report on a date period. | X | X | ||
| Show Value On | Set the date for a Price as of column. | X | X | ||
| Preview | See a sample of the PDF report with the selected settings. | X | |||
| View Top (Number) Holdings, Sorted By |
In the dashboard report, designate how holdings are displayed. Includes related setting:
|
X | X | ||
Report Actions
To learn more about reports in Tamarac, see Introduction to Reports.
To learn more about how to generate a report, change the data displayed, print or export the report data, and more, see Basics of Working With Reports.
To learn more about creating and using PDF reports, see Understanding PDF Reports and Workflow: Generate a PDF Report.