Contents
Introduction
Interactive dynamic reports are fully configurable reports that allow advisors and firm users like you to evaluate characteristics of a financial account, reporting group, account set, or, depending on the report, Household. Reports allow you to explore patterns, answer questions about trends or anomalies, and ask related questions about account data for holdings, transactions, performance, trading, and more.
If you're new to the Tamarac platform, this page provides a helpful overview and links for how to get started using basic reporting functionality.
This page focuses on features and use of the dynamic, interactive reports available in the Reports menu. For more detail about other ways of reporting on data, see:
-
An overview of all the reports and data in Tamarac. Learn about data types, report types, and more. For more information, see Introduction to Reports.
-
PDF reports. Learn about static, printable reports suitable for quarterly reporting: Understanding PDF Reports.
-
Bulk data export and upload. Most reports can only display data for account sets that contain up to 100 accounts. If you're looking to report on a large number of accounts, export large amounts of data, or explore data across many areas of Tamarac, see Understanding Bulk Data Exports and Understanding Bulk Data Uploads.
-
Dynamically updated dashboards. Customize the dashboard you see every time you first open Tamarac: Introduction to Dashboards.
-
client portal and mobile app. If you're interested in sharing data with clients in a dynamic and interactive format, see Setting Up Client Portals and Introduction to the Tamarac Mobile App.
Types of Data Reports Display
On the Tamarac platform, we collect and display financial account data from custodians. For each financial account, we display:
-
Basic account information like account number, taxable status, custodian, and owner's name.
-
Transaction information including transaction type, date, number of shares, value, and flow direction.
-
Holdings information like what financial instruments each account contains, including stocks, bonds, mutual funds, and more -- including the option for you to manually track securities like REITs.
Additionally, each financial account includes information like the owner's name, address, billing setup, service team, and unique account-level reporting preferences like whether to display accrued interest, account benchmarks, target allocations, and more.
Because financial accounts don't exist in a vacuum, the Tamarac platform also gives you ways to group together related accounts using groups, Households, or account sets. To learn more, see Introduction to Accounts, Groups, Households, and Clients.
You control almost all of an account's settings, which determine how reports display the data from the account.
When you run a report, you use the Find Data For list to choose which account, group, or account set you want to see data for.
When to Use Reports
Interactive dynamic reports serve you well when you want to:
-
Actively explore account and group performance, transactions, and holdings, and data trends, or troubleshoot unexpected returns.
-
Quickly answer a client question about their account.
-
Give clients real-time access to performance, holdings, or transaction data.
Tamarac offers other ways of interacting with financial account, group, Household, and client data, including:
-
PDF reports. Learn about static, printable reports suitable for quarterly reporting: Understanding PDF Reports.
-
Bulk data export and upload. Most reports can only display data for account sets that contain up to 100 accounts. If you're looking to report on a large number of accounts, export large amounts of data, or explore data across many areas of Tamarac, see Understanding Bulk Data Exports and Understanding Bulk Data Uploads.
-
Dynamically updated dashboards. Customize the dashboard you see every time you first open Tamarac: Introduction to Dashboards.
-
client portal and mobile app. If you're interested in sharing data with clients in a dynamic and interactive format, see Setting Up Client Portals and Introduction to the Tamarac Mobile App.
Access Reports
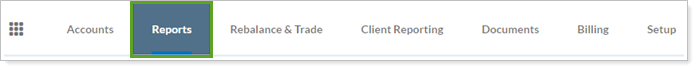
Run a report typically refers to generating a dynamically updated interactive on-screen report. These types of reports are a cornerstone of the Tamarac platform and provide access to data quickly and efficiently. You access reports from the Reports menu.
Report Views
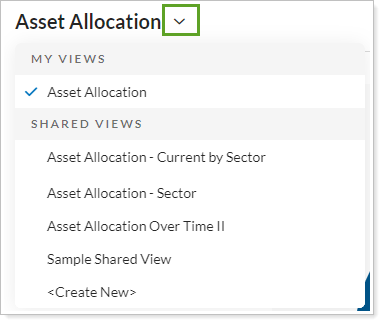
To configure reports, you create views that display the data in different ways depending on what you want to see. When you run a report, you choose which view you want to use to show the data.
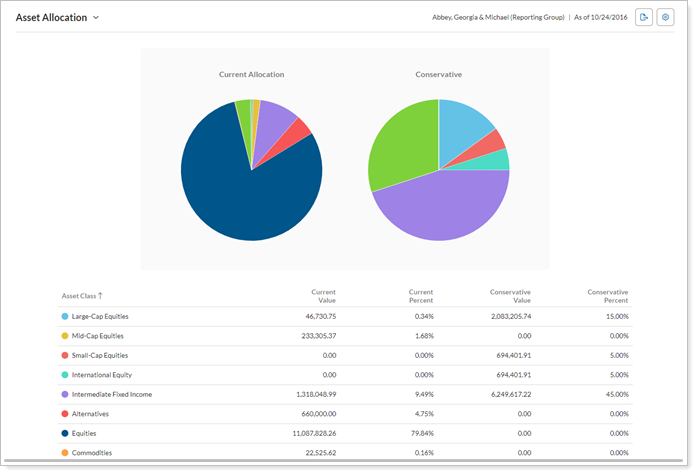
All firms and new users automatically receive a set of default views for each report. This means that you can run a report as soon as your financial account data and firm settings are configured. But you aren't limited to those default views; you can customize how a report shows the data using report views. For example, one view might show a group's current allocation compared with their target allocation, while another view might show the group's allocation over time.
For more information on how to customize reports using views, see Understanding Report Views.
When working with report views:
-
Create, Edit, and Delete a Report View: Learn how to customize the data displayed on a report by creating a new view, or edit or delete an existing view.
-
Copy a Report View: Learn how to copy a report view, useful for customizing a shared view.
-
Share a Report View: Make your report views available to other users in your firm.
Report Features
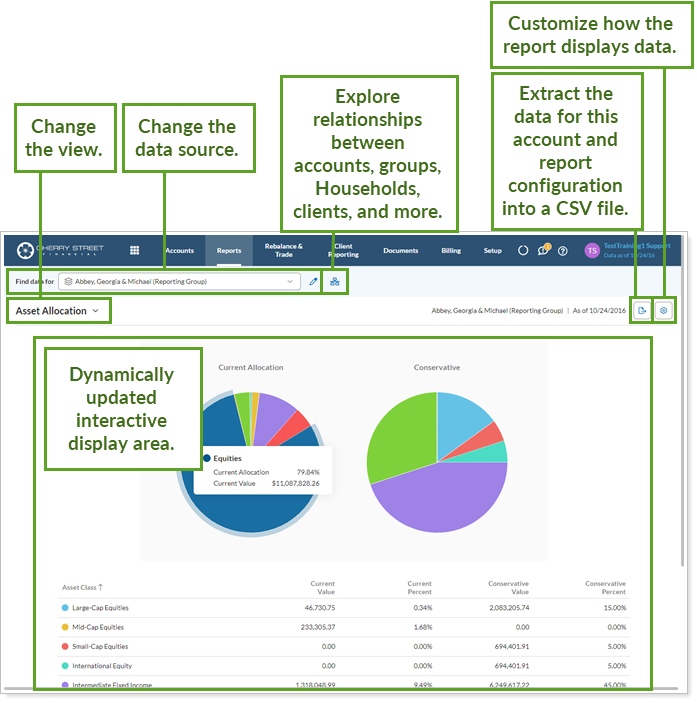
When you run a report, each report includes features that let you:
-
Choose what data to see by selecting an account, group, Household, or account set. For more information, see Use the Find Data For List.
-
Control how the report displays the data by customizing the specific report view settings. For more information, see Understanding Report Views.
-
Explore how the data source (account, group, Household, or account set) is linked to other groups, Households, and entities in the platform. For more information, see The Relationship Diagram.
-
Export the data you see in the interactive report into a CSV file. For more information, see Export Data from a Report. If you're interested in exporting large amounts of data across groups or account sets, see Understanding Bulk Data Exports.
Additionally, you can always print a report. However, we recommend using PDF templates for most print applications.
Control How Reports Look
Your firm configures the look and feel of reports using site themes, which control report colors, gradients, chart lines, line thickness, and more. Typically these are set up for your firm branding when your firm starts using the Tamarac platform.