
Contents
|
Navigation Options & Customizing the Menu Bar Set Vertical and Horizontal Line Thickness and Color Background Gradients for Charts |
Introduction
Themes allow you to change the colors and options used in the pie charts, bar charts, and line charts on your reports and dashboards. You can also use site themes to customize the look and feel of the menu bar for you as well as your clients. You can have different site themes for each of your clients or different groups of clients. Unlike PDF themes, site themes apply to dynamic reports, PDF reports, desktop client portals views, and the mobile app.
You can customize these options on the Themes page that's available on the Setup menu. The page comprises three primary sections:
-
Navigation Options/Menu Bar.The top menu bar consists of the primary navigation for Tamarac Reporting that holds the menus for Accounts, Reports, Client Reporting, Billing, etc. While the names of the menus cannot be changed, you can control the theme of the menu bar elements. Click here to learn more.
-
Graphic Options.Change line thickness, background gradient colors and styles, data line thickness, etc. Click here to learn more.
-
Color Options.Change pie chart colors, graph colors, and index colors. Click here to learn more.
Not all customization options are available for every report.
For an illustration of what each theme setting controls, see Theme Data Element Example.
Tamarac offers a number of pre-configured themes to save you time. To see all the default system themes, see Default Site Themes.
Navigation Options & Customizing the Menu Bar
The top menu bar consists of the primary navigation for Tamarac Reporting that holds the menus for Accounts, Reports, Client Reporting, Billing, etc. While the names of the menus cannot be changed, you can control the theme of the menu bar elements. You can customize the theme of the menu bar for you as well as your clients - and have different site themes for both. For example, you can have one brand for your menu bar and another for your clients or a subset of your clients.

For details on customizing the menu bar, visit Customizing the Menu Bar.
Graph Options
With graph options, you can control the look of graphs on your reports. Customization options under graph options include the following:
-
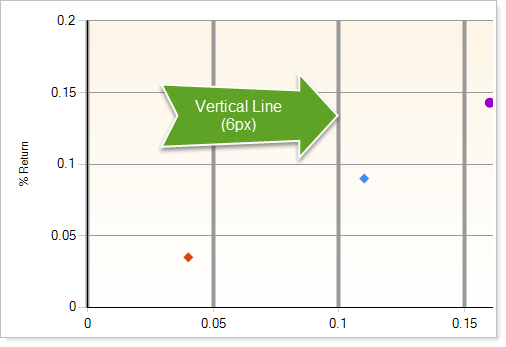
Vertical Line Thickness & Color.Choose the width (in pixels) and color of vertical lines on your charts.
-
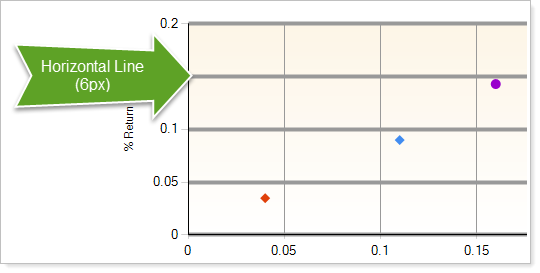
Horizontal Line Thickness.Choose the width (in pixels) and color of horizontal lines on your charts.
-
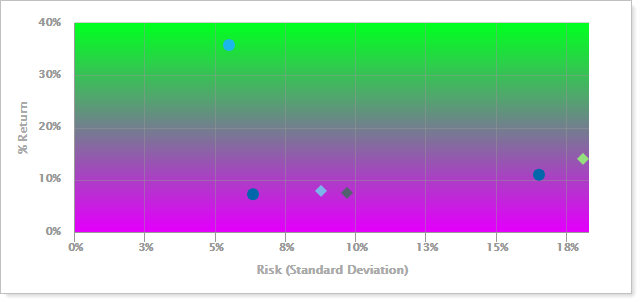
Background gradients.The background gradients of your charts can reflect your firm's brand. Simply choose the primary and secondary colors and choose the gradient style you want (left to right, right to left, top to bottom, etc.) and Tamarac Reporting will blend the colors in the background of your charts.
-
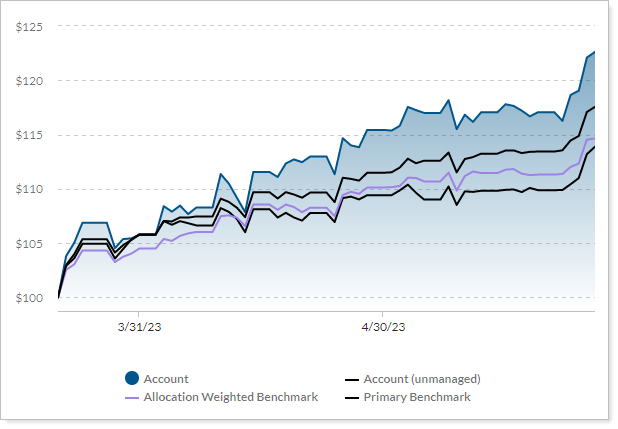
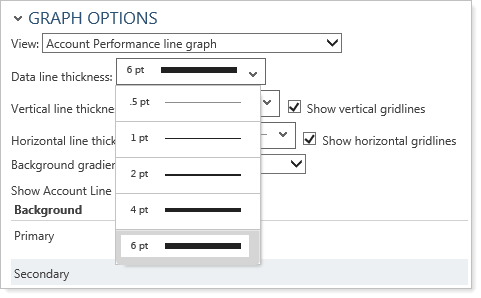
the Data line in line graphs. You have control over the thickness of the line on line charts.
Set Vertical and Horizontal Line Thickness and Color
To set the vertical and horizontal line thickness and color for your charts, follow these steps:
-
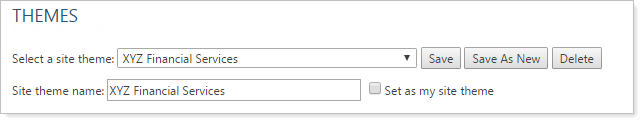
On the Setup menu, under Firm Settings, click Themes.
-
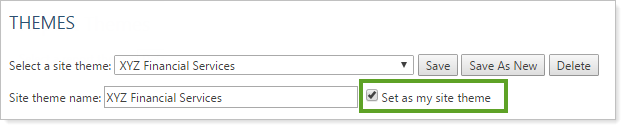
In the Select a site theme list, click an existing theme. To create a new one, select <Create New> and then type the name of the theme in the Site theme name box.
-
If you want the site theme to be your default theme for your version of Tamarac Reporting, select the Set as my site theme check box. You can only have one site theme assigned to yourself at one time.
-
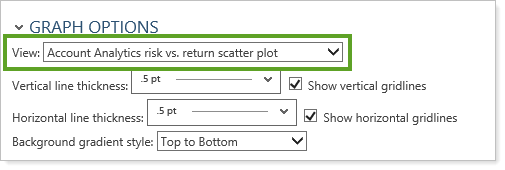
In the View list under Graph Options, click the area where you want to set the vertical and horizontal line thickness.
-
Complete any of the following:
-
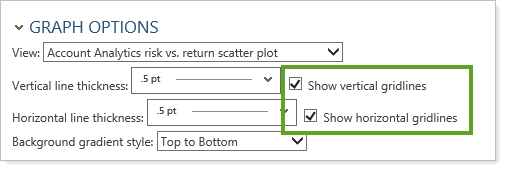
If you don't want to show the vertical or horizontal gridlines, select the Show vertical gridlines and/or Show horizontal gridlines check boxes.
-
Click Save. Repeat these steps for each chart you want to customize.
Background Gradients for Charts
The background gradients of your charts can reflect your firm's brand. Choose the primary and secondary colors and choose the gradient style you want (left to right, right to left, top to bottom, etc.) and Tamarac Reporting will blend the colors in the background of your charts.
Note
For a clean and modern look, try white (#FFFFFF) for the Primary and Secondary background color for your charts.
To set the gradient colors and style, follow these steps:
-
On the Setup menu, under Firm Settings, click Themes.
-
In the Select a site theme list, click an existing theme. To create a new one, select <Create New> and then type the name of the theme in the Site theme name box.
-
If you want the site theme to be your default theme for your version of Tamarac Reporting, select the Set as my site theme check box. You can only have one site theme assigned to yourself at one time.
-
In the View list under Graph Options, click the area where you want to customize the background gradients.
-
In the Background gradient style list, choose a gradient style for your charts. If you don't want a background gradient, click None.
-
Modify the Primary Background Color and Secondary Background Color as desired.
-
Click Save. Repeat these steps for each graph type you want to edit.
Data Line Thickness on the Account Performance Line Graph
You have control over the thickness of the line on line charts.
To set the thickness of the data line on line charts, follow these steps:
-
On the Setup menu, under Firm Settings, click Themes.
-
In the Select a site theme list, click an existing theme. To create a new one, select <Create new site theme> and then type the name of the theme in the Site theme name box.
-
If you want the site theme to be your default theme for your version of Tamarac Reporting, select the Set as my site theme check box. You can only have one site theme assigned to yourself at one time.
-
In the View list under Graph Options, click Account Performance line graph.
-
In the Data line thickness list, choose the applicable thickness in pixels.
-
Click Save.
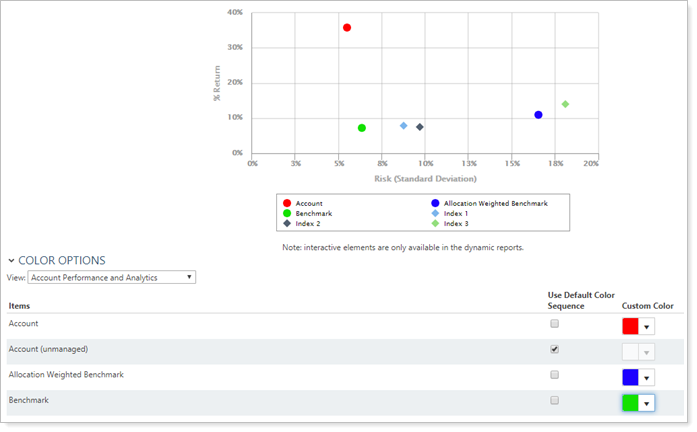
Color Options
When viewing Tamarac Reporting PDF reports, sometimes it's confusing to visualize some items on your reports when the colors vary between reports—for example, green may represent bond funds on one report and commodities on another or gridlines may appear on one report and not on another.
To make the visualization easier, you can customize the category and index colors you'd like to display. With the color options, you can specify the report color for each asset class, security type, sector, and subsector. The colors you specify will be shared among your dynamic and PDF reports, creating a consistent look and feel for all reports and portal sites.
To assign a color to a graph, index, pie chart, etc., follow these steps:
-
On the Setup menu, under Firm Settings, click Themes.
-
In the Site theme name box, type a name for the theme. With Tamarac Reporting, you can create multiple theme templates and assign them to specific report templates as necessary.
-
If you want the site theme to be your default theme for your version of Tamarac Reporting, select the Set as my site theme check box. You can only have one site theme assigned to yourself at one time.
-
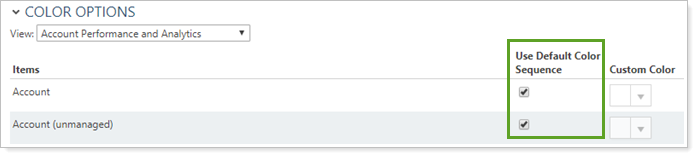
In the View list under Color Options, choose the report type you want to modify.
-
For the item where you want to assign a color, clear Use Default Color Sequence and choose a custom color.
-
When finished assigning colors, click Save.
Assign Site Themes
Once you've created a theme, you can use it in client views and PDF templates as well as on your site. For more information about using site themes, see: