 Back
Back|
Back |
|
View (Theme Settings Color Options)
For most reports, you can customize colors for specific characteristics. This setting allows you to select the report you want to customize colors on. For example, you can set the account line on the Account Performance report to be the same blue as your firm logo, and then set all the benchmarks to shades of gray that match.
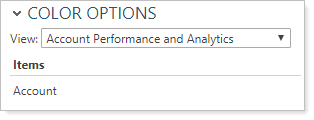
The site theme settings available change depending on what you select from the list. You can customize colors on the following reports:
Account Performance and Analytics.This option lets you set the colors for the graphs on the Account Performance report and Account Analytics report.
Asset Allocation.This option lets you set the colors for the Asset Allocation bar chart (to change pie chart colors, use the Categories option).
Bond Analysis.Lets you set the Bond Analysis bar chart color ratings if you're not using a smoke stack and the Bond Analysis bar chart average line color.
Bond Ratings.Lets you set the colors for bond ratings on your fixed income reports.
Capital Flows.Controls the colors for account value, contribution and net investment on the Capital Flows report.
Categories.This option lets you set the colors for categories. Select this option to adjust the colors for pie charts.
Indexes.This option lets you set the colors for indexes.
Net Worth.Control the look of the chart on the Net Worth report. You also have some additional options in the Graph Options section.
Projected Income.Defines the colors for the Projected Income bar chart colors (paid income as well as projected income).
Summary.Controls the color of the bar chart on the Summary report.
For each report element, you can configure the following settings:
For more information on site themes and customizing chart colors, see Site Themes.
For more information about customizing the menu bar, see Customizing the Menu Bar.