 Back
Back|
Back |
|
Net Worth Report
| Applies to: | |||
|---|---|---|---|
| ✔ Dynamic | ✔ Mobile | ✔ Client Portal | |
With the Net Worth report, you can see a client's whole financial picture in one place. The Net Worth report combines assets and liabilities—whether entered manually or by linking outside accounts—with holdings information from Tamarac Reporting to allow you to tell your clients' complete financial story.
Before you can see assets and liabilities on this report, you must add the assets and liabilities to Households in Tamarac Reporting. For more information on how to do that, see Assets and Liabilities.
For more information on using the Net Worth report to see assets and liabilities, see View Assets and Liabilities on the Net Worth Report and Workflow: Set Up Net Worth Reporting.
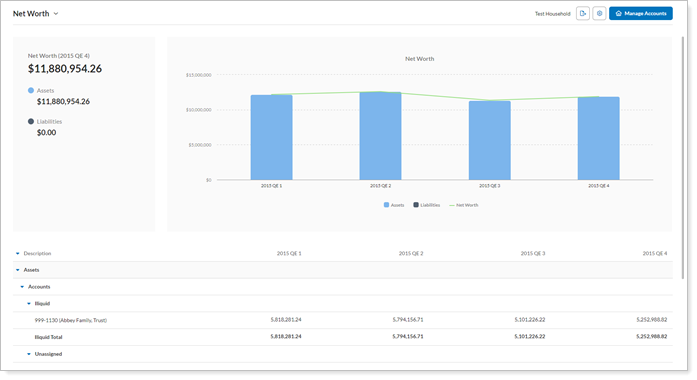
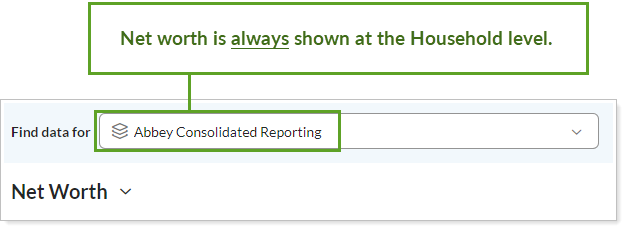
Unlike other reports, the Net Worth report shows information for the primary Household and not for an account, regardless of what's shown in the Find Data For list. In other words, even if you try to view the Net Worth report for a single account, Tamarac Reporting will show net worth for that account's primary Household instead.
The account or group must have a primary Household assigned to see the Net Worth report.
In the Net Worth report, you will find a powerful tool for aggregating and reporting on a Household's holistic financial picture. It helps you answer questions such as:
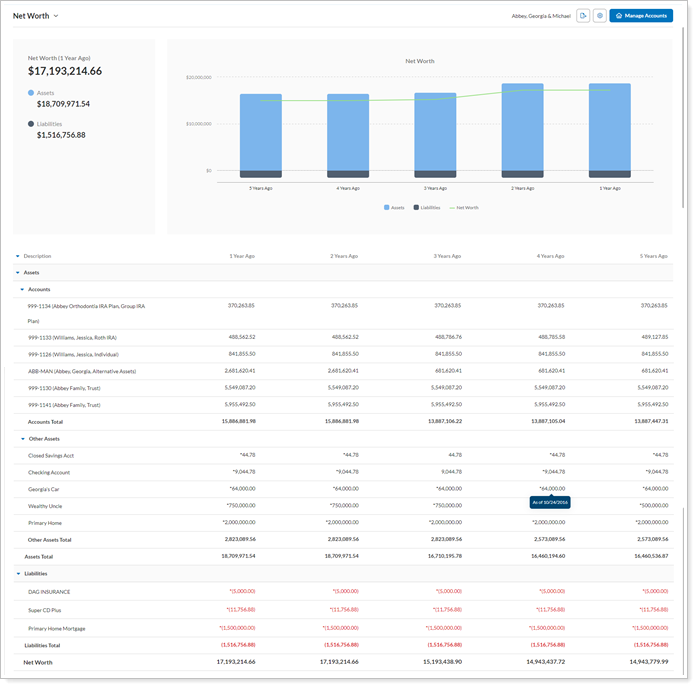
How has my client's Net Worth Changed Over Time?See year-over-year changes in a Household's net worth displayed with each year's values listed side by side for easy comparison. You can choose any as-of date for up to five different data points, allowing you to display, for example, five years' worth of changes, or each quarter for the last five quarters, or every other year for ten years, etc.
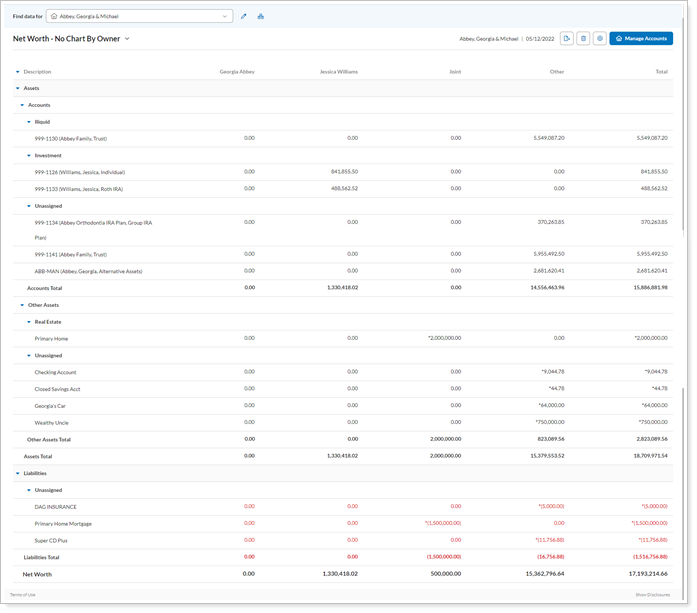
In this Household, which assets and liabilities belong to which clients?Review how assets and liabilities are distributed among Household members.
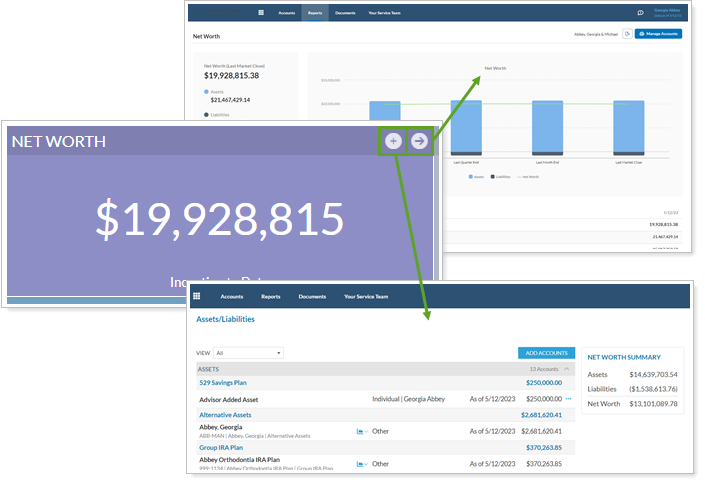
Can my clients monitor net worth themselves? Add the Net Worth report to the client portal to put give clients access to their net worth details any time. Add the net worth data points to a client portal dashboard tile to display assets, liabilities, and total net worth on the dashboard.
A client worked with the same advisor for the last five years. During that time, the clients took out some loans to start their own business. As the year-end meeting with the client approaches, the advisor wants to show how the client's net worth has changed since the start of their relationship.
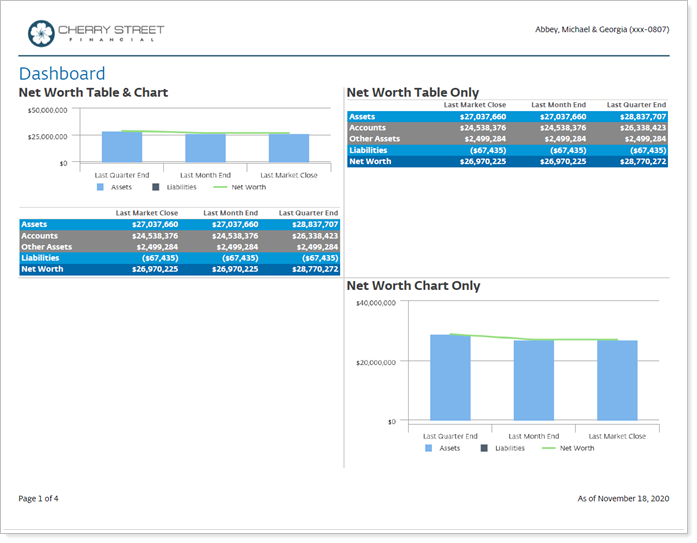
The advisor generates a basic Net Worth report showing both a chart and a table reflecting assets and liabilities for each of the last five year-ends, which clearly lays out changes in the client's net worth over that time.
An advisor anticipates discussing the client's estate plan in an upcoming meeting with her clients. In preparation, she generates a Net Worth report that displays assets and liabilities by account owners and groups them by net worth category. This allows her to see a breakdown of who owns what in the Household, sorted by the various categories of assets and liabilities.
Cherry Street Financial wants to give clients direct access to their net worth at any time. They create and add a Net Worth report to the client view. Additionally, they create a dashboard tile that includes net worth data points. Because Cherry Street uses Yodlee linked accounts to bring in held-away assets and liabilities, they include an Assets & Liabilities page in the client portal as well.
In the client view, then, clients can see their net worth on a dashboard tile, in detail on the Assets & Liabilities page, and on the Net Worth report. Cherry Street linked the Net Worth report and the Assets & Liabilities page from the dashboard tile for easy client access.
The Net Worth report helps you easily display aggregated asset and liability values over time or by owner. Interactive reporting features include the following.
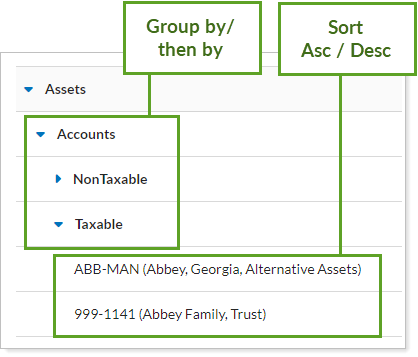
Group accounts by tax status, net worth category, or account type, or a combination of these, to display the unique report that's right for your clients.
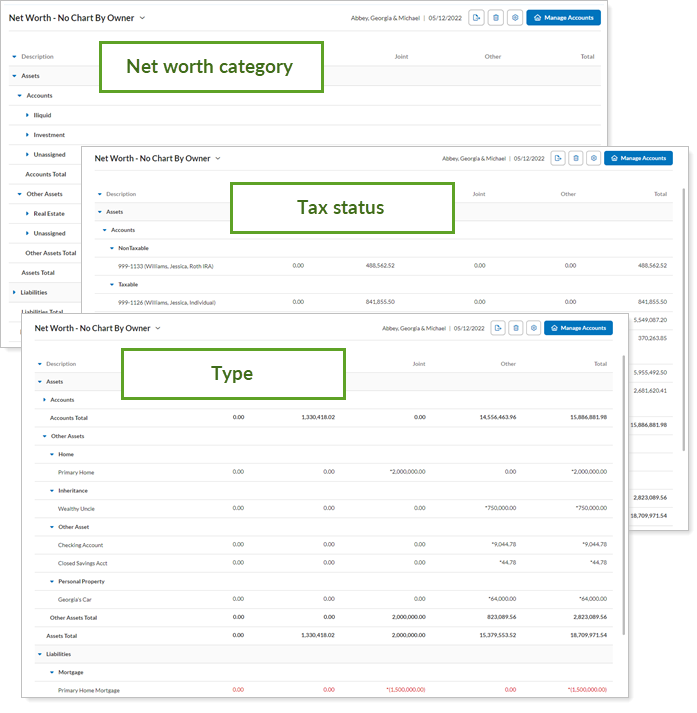
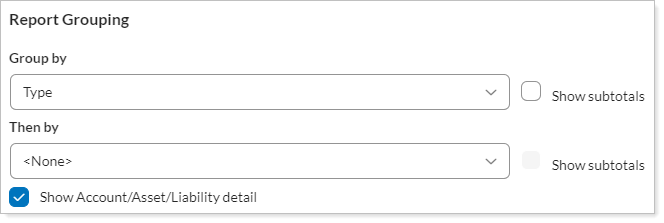
To choose how the table groups assets and liabilities, use Group By/Then By.
You can group by the following:
Type (called Account Type in accounts and Choose Asset/Liability Type in assets and liabilities)
Create the most impactful PDF statement you can by showing clients the net worth in the way that makes the most sense to them. You can include the chart, the table, or both in PDF full and PDF dashboard sections. For more information, see Show Table and Show Chart.
Sort by ascending or descending for any column in the report to show accounts, assets, and liabilities in the order you want. For more information, see Asc / Desc.
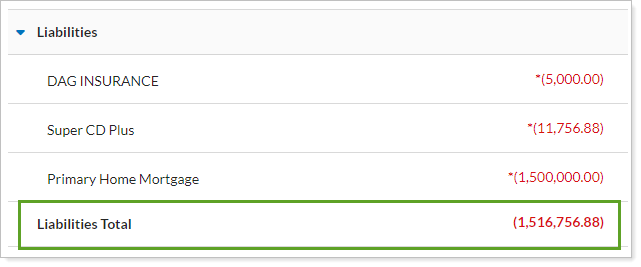
Set up the Net Worth report to display subtotals wherever you feel it's logical: In the top bar (default) or in a subtotal row at the end of each section. For more information, see Display totals at bottom.
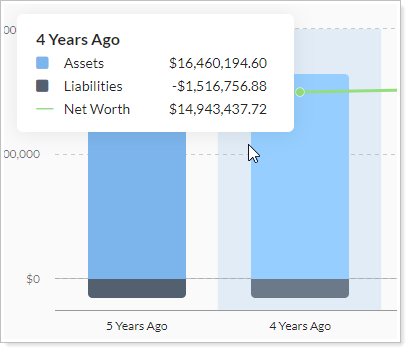
See data details by hovering over a bar on the chart—you will see a tooltip display that summarizes the relevant net worth details for that date.
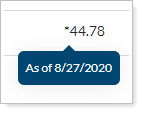
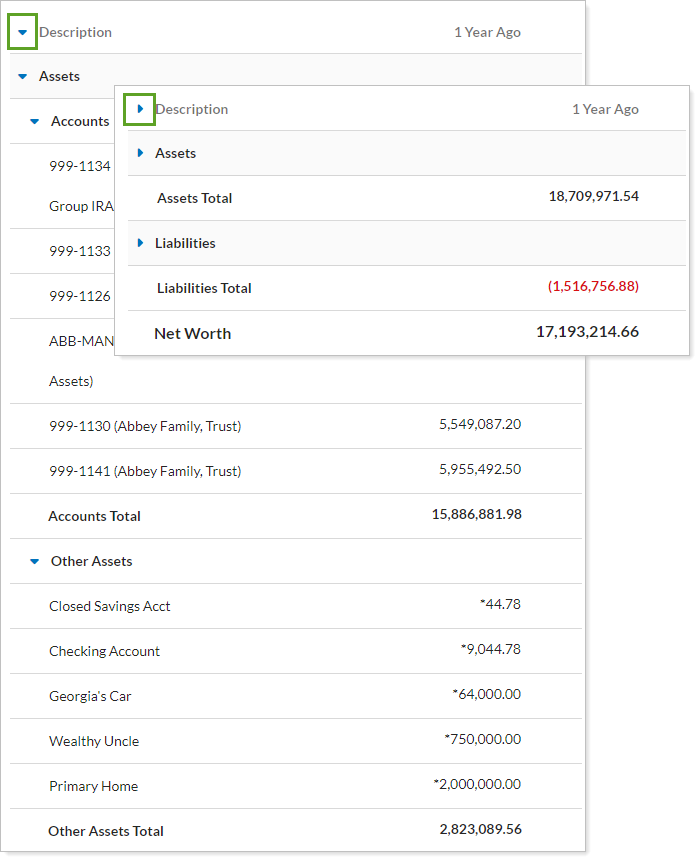
See the as of date for the value of assets and liabilities by hovering over a value marked with an asterisk.
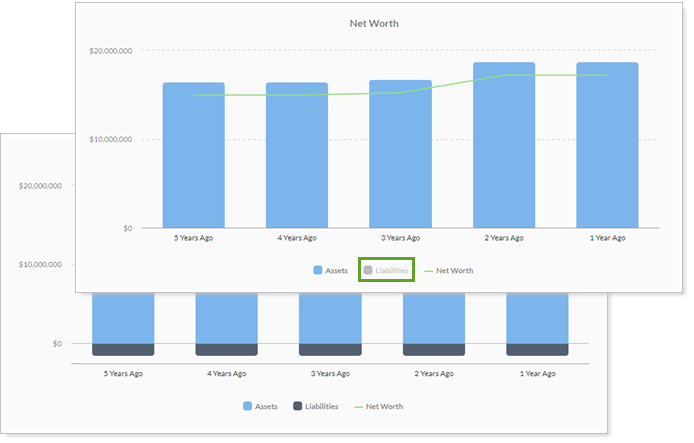
Click data points in the chart legend to show/hide data points.
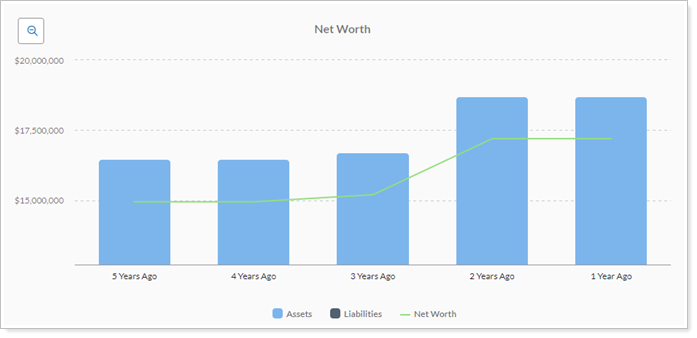
Zoom in on the chart by clicking and dragging to select an area. Reset your zoomed chart by selecting the  button.
Expand (>) or collapse (˅) table rows to further control the level of detail.
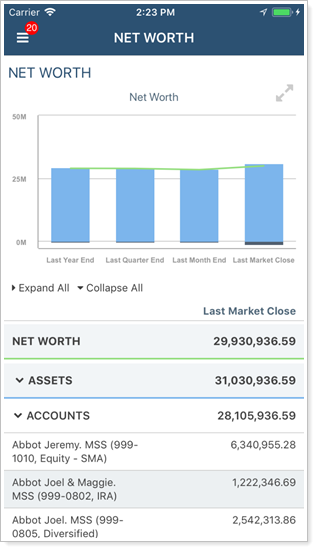
This report is optimized for mobile viewing, making it easy to use on any device, anywhere. To learn more about mobile app report features, see Mobile App Reports.
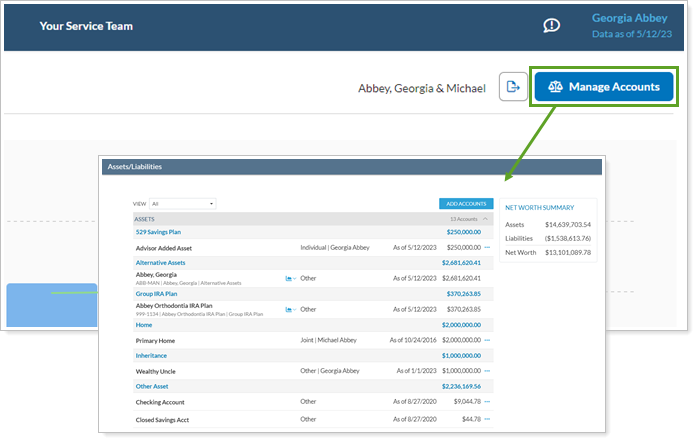
Open Assets and Liabilities panel to directly manage assets and liabilities for the Household you've run the Net Worth report on. This allows you to quickly update a manual asset or liability if you notice an issue while reviewing the report.
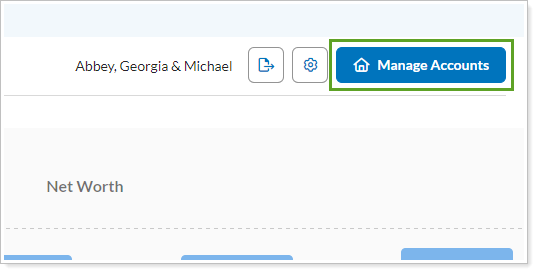
When you add the Assets/Liabilities page to a client view, the Net Worth report includes a button that allows clients to manage assets and liabilities directly from the report. For more information about allowing clients to manage assets and liabilities themselves, see Allow Clients to Manage Assets and Liabilities on the Portal.
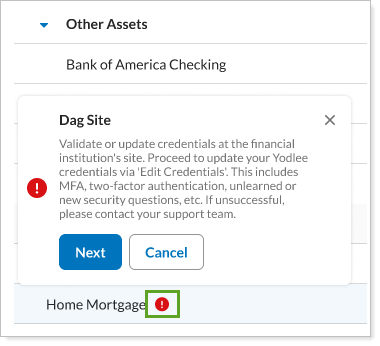
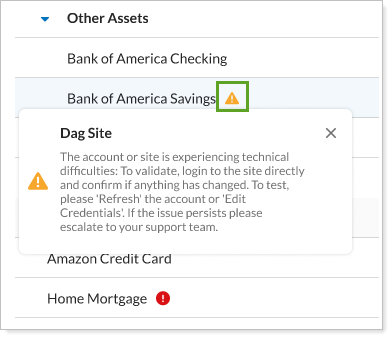
The Net Worth report displays linked account errors and allows you or your clients to resolve some of them. The page shows two types of alerts: actionable and informational.
You and your clients can both resolve this type of linking error. Select the alert icon to start resolving the issue. Clients only see the actionable link error for accounts where they are the credential owner.
Clients will see the alert, but only you can fix this type of linking error.
There is no Net Worth reporting dashboard widget available.
The following settings are available for the Net Worth report. Click the setting name for more details.
| Setting | Details | Available In... | ||
|---|---|---|---|---|
| Dynamic Report | PDF Report | PDF Dashboard | ||
| Asc / Desc | Sort by one of the columns in the report. | X | X | |
| When you show a chart, this setting allows you to choose what date data points are displayed. | X | X | X | |
| When you show a chart, this setting allows you to add a custom title or no title. | X | X | X | |
| Column Display | Set columns on the Net Worth report to be the account owners or dates. | X | X | |
| Columns / Show Values On | Configure which dates appear as columns on the report. | X | X | X |
|
Called Display net worth totals at bottom on the PDF Dashboard |
Control where the report displays the subtotal for each section. | X | X | X |
| Group By/Then By |
Organize the report by various categories. |
X | X | |
| Header and Footer | Choose a unique header and footer for the section or use defaults. | X | ||
| Include Page Break After This Section |
Control where page breaks occur in PDF reports. |
X | ||
| Mark as Publicly Accessible | Share the report view. | X | ||
| Report Name | Designate a unique name for the report view. | X | ||
| Report Section Titles |
Customize the names of each section that appears on the report. |
X | X | X |
| Section Title | Designate what the section will be called in the PDF report. | X | X | |
| Theme | Designate what theme the section will use. | X | ||
| Show Account/Asset/Liability Detail | Show or hide the asset and liability details. | X | X | |
| Choose whether to mark liabilities as negative values or not. | X | |||
| When you show a chart, this setting allows you to add bar chart bars. | X | X | X | |
| Show Chart |
Display and configure settings for a net worth summary chart. |
X | X | X |
|
Called Show Asset Sub-Sections in PDF version of the report. |
Show assets broken out by Accounts and Other Assets, or summarized together in one section. | X | X | X |
| Show Subtotals |
Add subtotals to each grouping level when you Group by. |
X | X | |
| Show Table | Show or hide the data table in the PDF version of the report. | X | X | |
| When you show a chart, this setting allows you to show or hide a trending line. | X | X | X | |
| Use Date as Title | Use the date (MM/DD/YYYY) as the title of the column heading, rather than the name of the date period. | X | X | X |
To learn more about reports in Tamarac, see Introduction to Reports.
To learn more about how to generate a report, change the data displayed, print or export the report data, and more, see Basics of Working With Reports.
To learn more about creating and using PDF reports, see Understanding PDF Reports and Workflow: Generate a PDF Report.
For more information about Net Worth report-specific actions, see: