| Applies to: | ||
|---|---|---|
| ✔ Dynamic |
✔ Client Portal |
|
Use this Net Worth report setting to show or hide a bar chart that summarizes net worth values over a series of dates that you set. The chart provides a clear visual summary of net worth change year over year on the client's report.
You can choose:
-
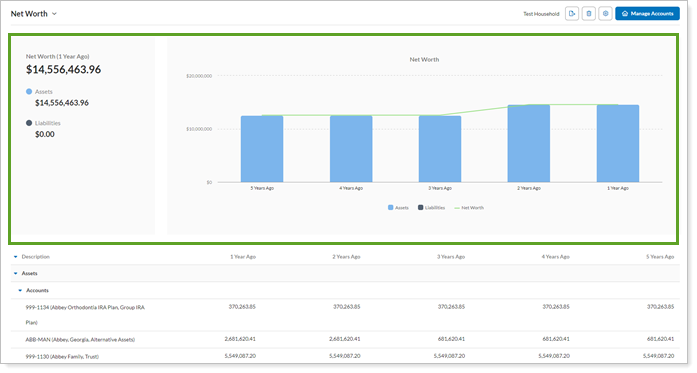
Selected. The report includes a summary section and a bar chart with optional trending line above the net worth table.
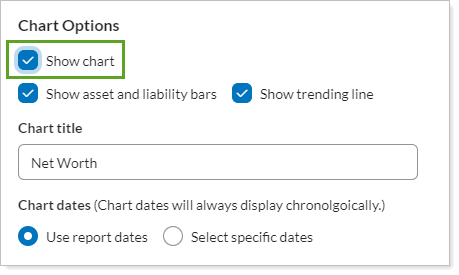
When you select Show chart on the Net Worth report, you can customize it using the following settings:
-
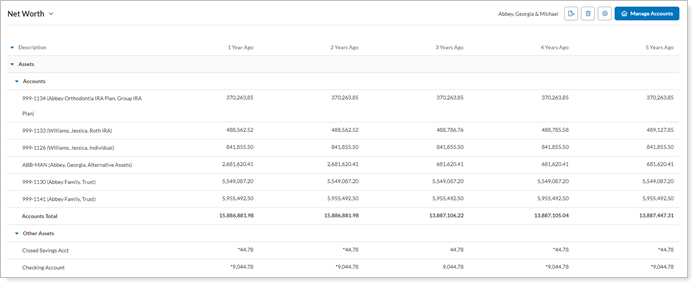
Cleared. The report displays only the table.