
| Applies to: | ||
|---|---|---|
| ✔ Dynamic | ✔ Client Portal | |
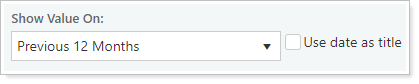
Use this setting to configure which dates or date periods appear as columns or data points on the report.
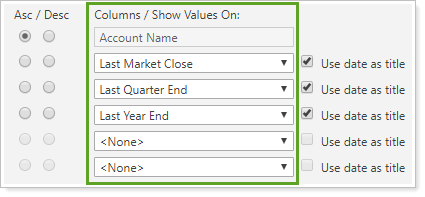
To show a value or values for specific date periods, select a date period from the list. If the date you want does not appear in the list, you can add your own dates. For more information, visit Dates and Date Periods. Control what the date is called with Use date as title.
Net Worth Report
On the Net Worth report, Columns / Show Values On serves two purposes:
-
To add up to date columns to the report. The number of columns available to add depends on the Column Display setting.
-
To sort accounts, assets, and liabilities displayed on the report by either value or account name. For more information on sorting, see Asc / Desc.
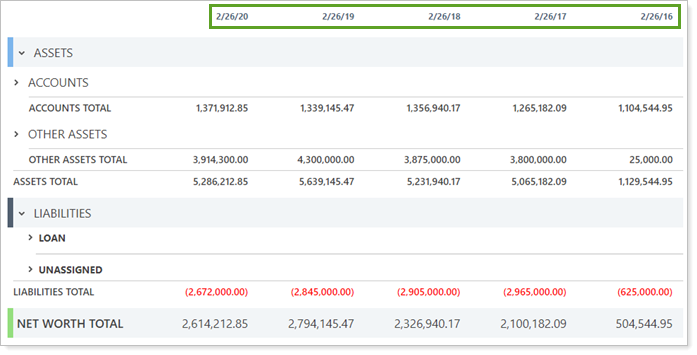
On the Net Worth report table, when you choose a date from the list, that date is added as a column.
On the Net Worth report chart, you can choose chart dates specifically when you set Chart Dates to Select specific dates. You can add up to five date periods to the chart.
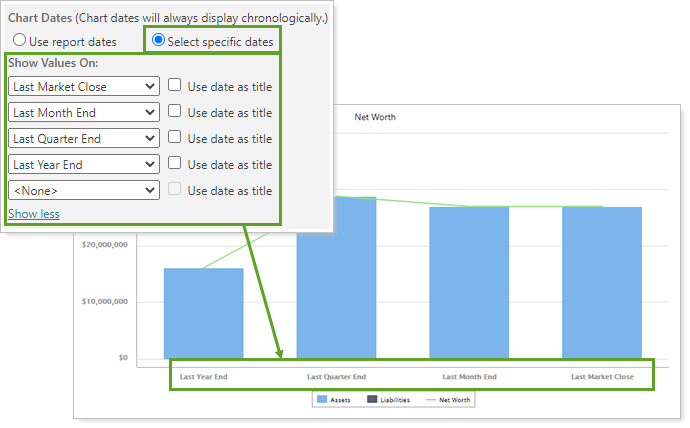
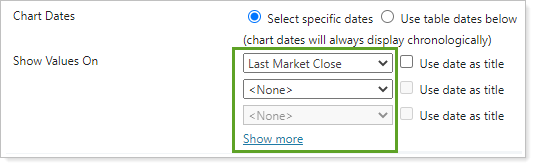
For more information about chart date options, see Chart Dates.
For more information about the Net Worth report, see Net Worth report.
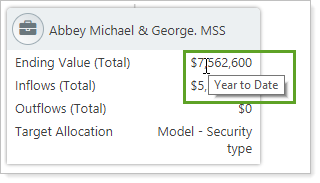
Relationship Diagram
When you choose a date, the card displays the value on that date for the account, group, or Household. Hover over the value to see the date period.
For more information about the Relationship Diagram, see Relationship Diagram.
Learn More
The following settings and processes interact with this option: