
Contents
Introduction
| Applies to: | |||
|---|---|---|---|
| ✔ Dynamic | Mobile | ✔ Client Portal | |
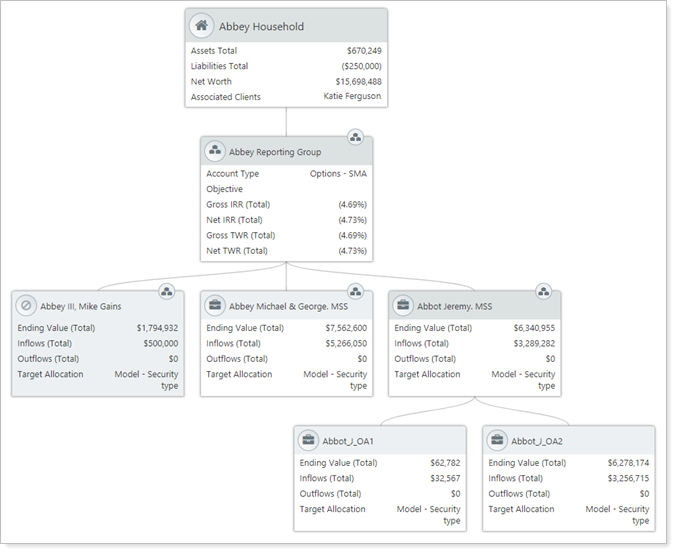
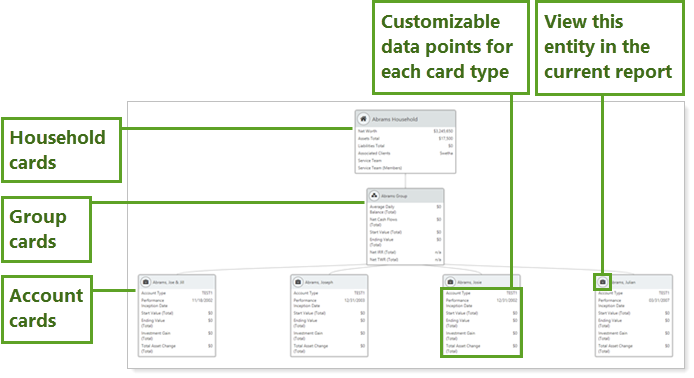
The relationship diagram shows how accounts, groups, and Households are connected with each other by displaying connections in a visual tree structure. Each entity is displayed on a card, and each card displays fully customizable data points. This diagram shows how accounts and groups are organized within groups and Households. It can also be useful for troubleshooting setup and understanding complicated Household structures.
In the relationship diagram, you'll find the following features:
-
Easily identify how entities relate to one another. See a tree mapping out connections between accounts, groups, and Households.
-
Include metrics for each entity. See such account details as account type, custodian, and primary owner, plus such Summary report details as returns, inflows and outflows, current value, and more.
-
Efficiently Switch to a related entity. Within a report, open the relationship diagram and click the entity icon in the left corner of a card to view the report for that entity. Click Quick Look button to learn more about the entity's group and Household membership.
The Relationship Diagram and Entities
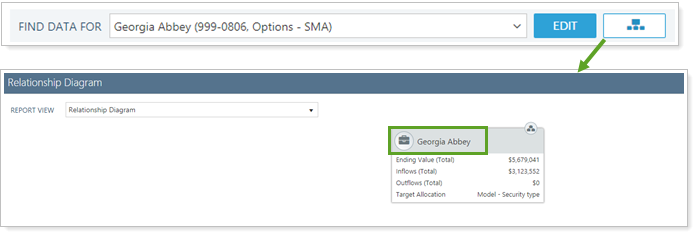
The relationship diagram is generated for whatever entity is listed in the Find Data For list. For example:
-
Account LevelIf there is an account currently selected in the Find Data For list, the relationship diagram generated will start with that account.
-
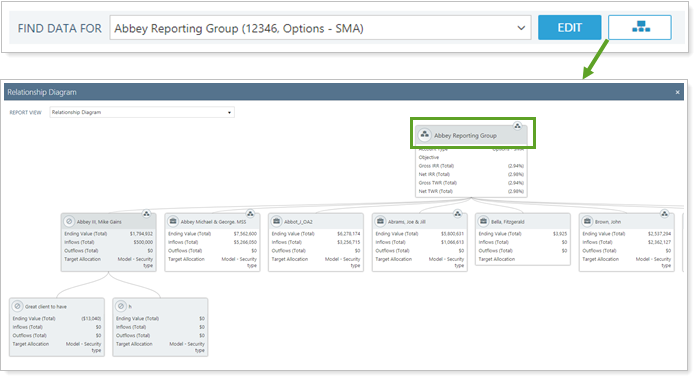
Group LevelIf there is an group currently selected in the Find Data For list, the relationship diagram generated will start with that group and display any accounts or groups added to the group.
The relationship diagram respects the entity display limitations of the report. For example, if a report doesn't display Households, only accounts and groups will be available for viewing in the relationship diagram on that report page. On the Relationship Diagram page itself, you can view any Households, groups, or accounts.
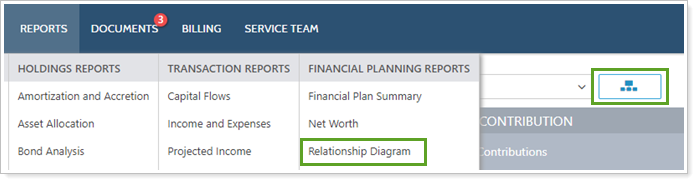
Access the Relationship Diagram
In addition to being available on the Reports menu, find the Relationship Diagram next to the Find Data For list on many pages. For more information, see Access the Relationship Diagram.
Why Use the Relationship Diagram?
In the relationship diagram, you will find versatile settings that let you answer many questions about entity relationships, such as:
-
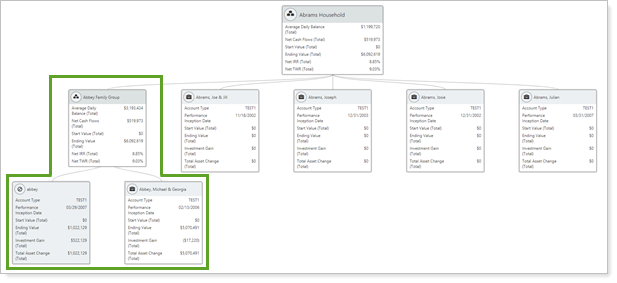
What accounts and groups are in this household? See a tree that maps connections between accounts, groups, and Households. Start the tree at any entity level to see all connections from that level downward, including all direct and indirect members.
-
Is this Household Correctly populated? Confirm the accuracy of Household, client, group, and account assignments and troubleshoot when it looks like something may have been inaccurately categorized.
-
What clients own which accounts? What returns or flows occurred in the accounts? Add a wide variety of data points to each card type, including primary owner, service team, returns, flows, and more.
See the Relationship Diagram in Action
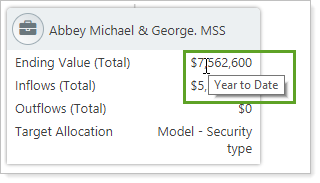
Looking at a Holdings report, you notice some unique holdings you didn't expect to see in that group. You wonder why those particular holdings are showing up. The first step in troubleshooting is to confirm which accounts are members of the group.
To quickly check group membership, click the  button next to the Find Data For list. This opens the relationship diagram for that group, establishing that the group holding those unique securities (marked in green) is a direct member of the group you're looking at.
Features of the Relationship Diagram
The relationship diagram is easily customizable. Interactive reporting features include the following.
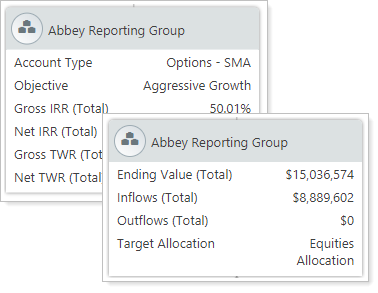
This report displays managed, unmanaged, and total account value, flows, returns and more data points from the Summary report. For details and considerations about these data points, see Summary Report Data Point Calculations.
Customize the Data Points on Tiles
As with dynamic reports, the data points on the relationship diagram are configurable. To change data points on a tile, access the full relationship diagram and click Edit on the relationship diagram page. This allows you to control what data are displayed on each card type, choosing from a wide variety of account and Summary report data points.
Identify Entities With Icons
Familiar icons help you identify what entity type each card is. Icons are:
| Icon | Entity Type/Action |
|---|---|
|
|
Account |
|
|
Closed account |
|
|
Group |
|
|
Household |
|
|
View the report for that entity. |
Switch Find Data For List Selection
When you hover over the account, group, or Household icon on a specific card, it changes to a magnifying glass. Click this to display the report for that entity. This is useful if, for example, you want to look at the performance of a group and then each of its direct members individually.
![]()
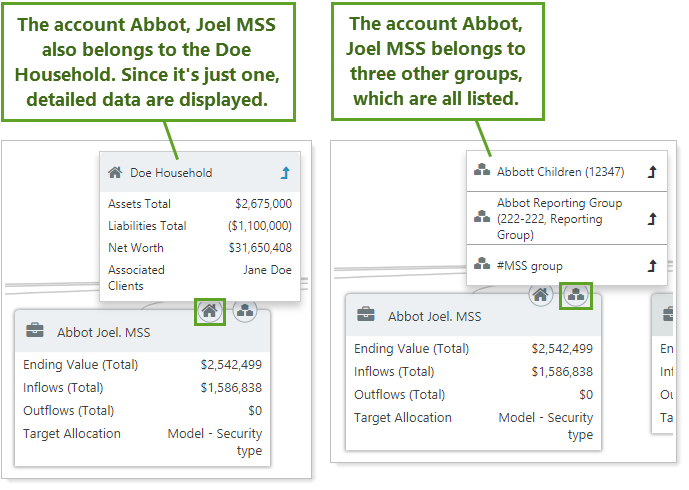
Identify and View Group and Household Membership
Any account or group that belongs to multiple groups or Households is marked with a Quick Look button. You can:
-
Click the applicable Quick Look button to see a list of other groups or Households the account belongs to.
-
Click
 to set that group or Household as the top node in the relationship diagram.
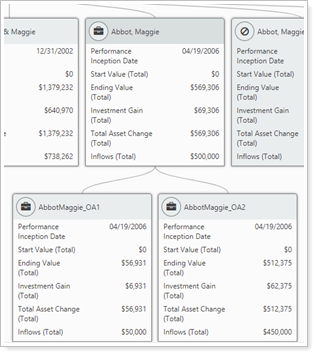
See Ownership or Demonstration Accounts
See ownership accounts in the context of their parent account and the overall group and Household.
For more information about these types of accounts, see Understand Partial Ownership Accounts and Create Generic Demonstration Accounts.
Use Tooltips to See Details
Hover over the name of the account to see the account number. Hover over a data point to see the As of Date.
Include on the Client Portal
Share the relationship diagram with your clients to help them visualize how their accounts and groups relate to each other. The Relationship Diagram is available as a report page under Client Views or next to the Find Data For list. In client portals, it shows only accounts and groups in that client's Household.
Relationship Diagram Settings
The following settings are available for the relationship diagram. Click the setting name for more details:
| Setting | Details |
|---|---|
| Report Name | Designate a unique name for the report view. |
| Group Allocation Weighted Benchmark By | Designate which category of allocation weighted benchmark is used in the return calculations. |
| Annualize Returns | Report the returns as annualized returns. |
| Include Intra-Group Flows | Include or exclude intra-group flows. |
| Add Data Point |
Choose which data points are displayed and in what order on each card. This setting includes the following options:
|
Manage Relationship Diagram Views
The relationship diagram is controlled using the same report view functionality you're already used to seeing in reports.
To learn more about reports in Tamarac, see Introduction to Reports.
To learn more about how to generate a report, change the data displayed, print or export the report data, and more, see Basics of Working With Reports.
To learn more about creating and using PDF reports, see Understanding PDF Reports and Workflow: Generate a PDF Report.