
Contents
How Adding a Relationship Diagram Card Data Point Works
| Applies to: | ||
|---|---|---|
| ✔ Dynamic | Client Portal | |
On the relationship diagram, you can customize what data points are displayed on each card type. Account cards, group cards, and Household cards can each display different data points. This allows you to create multiple views for the relationship diagram, just like a dynamic report. For example, you might choose to have one view that focuses on Net Worth and how each entity contributes to Net Worth, and another view that focuses on returns and transactions.
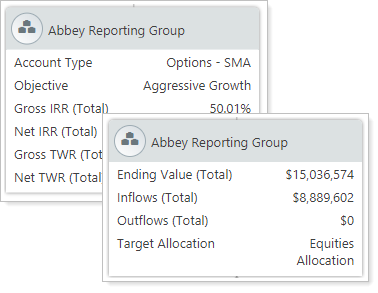
Use the Card Data Points settings section to customize what data points each card displays by adding up to six data points to each card.
Choose from the following data points:
Accounts
Account cards can display the following data points:
- Account Type
- Assigned Model, if your firm has Advisor Rebalancing
- Custodian
- Discretionary
- Objective (current only)
- Account custom fields
- Performance Inception Date
- Primary Owner
- Summary report data points, including returns, flows, fees, actions, value, and more
- Target Allocation
Groups
Group cards can display the following data points:
- Account Type
- Objective (current only)
- Performance Inception Date
- Summary report data points, including returns, flows, fees, actions, value, and more
- Target Allocation
- Account and Group custom fields
Households
Household cards can display the following data points:
- Assets Total
- Associated Clients
- Liabilities Total
- Net Worth
- Service Team
- Service Team (members)
- If your firm is enabled for the MoneyGuide integration, you can also display MGP Current Probability of Success, MGP Recommended Probability of Success, and MGP Last Import Date.
In Dynamic Reports
In the relationship diagram, customize the data points displayed on each card type with the following steps:
-
On the Reports menu, under Financial Planning Reports, click Relationship Diagram.
-
Click Edit.
-
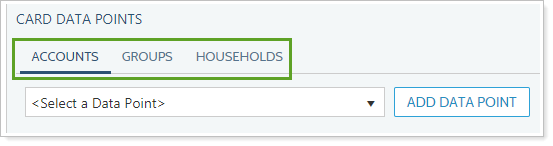
Click the card type that you want to edit.
-
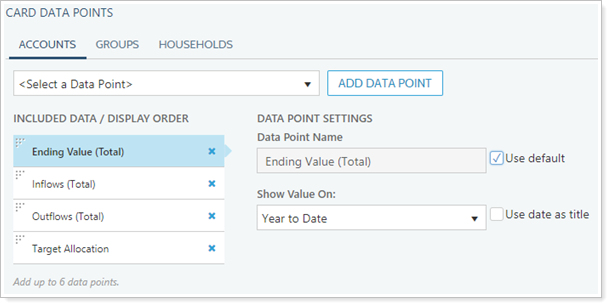
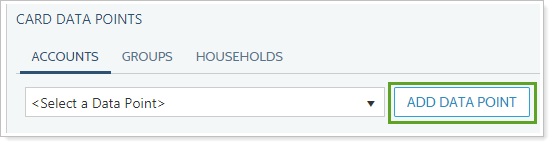
From the list of available data points, select one data point you want to add to the card. Click Add Data Point. You can add up to six data points to each card.
-
For each data point, you can take the following actions:
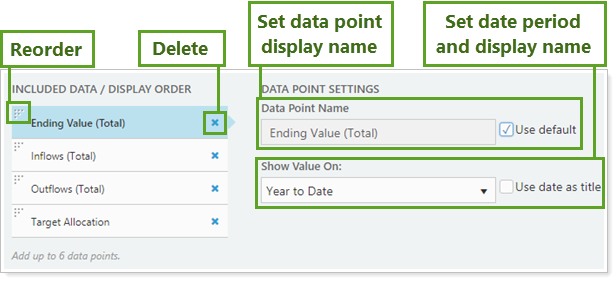
Action Steps Reorder Click  in the corner and drag the data point to the desired order.
Delete Click ✖ in the corner to remove the data point from the card.
Set data point display name Under Data Point Name, type the name you want to see appear on the card. For more information, see Data Point Name and Use Default.
Set the date period Under Show Value On, choose the date period you want to use for that data point. To learn more about this setting, see Show Values On.
For more information on how the date period is displayed, see Use date as title.
Set the date period for each data point individually.
-
Click Save to overwrite the current view. Click Save as New to create a new view. For more information on report views, see Understanding Report Views.
In PDF Reports
This diagram is available for dynamic reports only.
Reports With This Setting
Financial Planning ReportsRelated Settings
For more information about the Summary report, see Summary report.
For more information about the MoneyGuide integration, see Introduction to the MoneyGuide Integration.
This feature works similarly to the following setting: