
Contents
Introduction
| Applies to: | |||
|---|---|---|---|
| ✔ Dynamic | Mobile | ✔ Client Portal | |
The Summary report gives a broad, holistic overview of what took place in an account or group over one or more date periods. You can display a wide range of data points, including value, flows, benchmarks, and returns for managed and unmanaged assets in the Summary report.
The report displays a table of the data you select. Benchmarks can be added to the table for easy comparison against the account. It can also include a bar chart that always displays net contributions, capital appreciation, income, management fees, and other expenses for the first date period in the table.
Why Use the Summary Report?
In the Summary report, you will find versatile sorting and charting options that let you answer broad, high-level questions about accounts and groups, such as:
-
What is the overall story of this account or group?Use the Summary report to tell the story, in broad strokes, of what activities—transactions, flows, returns, and more—occurred in the account or group over one or more date periods.
-
What did this account look like at the beginning and end of a period?When looking at just one date period, the Summary report allows you to show broadly the changes in an account or group over that period, and what caused the changes.
-
Are there any Activity trends in this account or group? By setting the report to display up to five date periods, you can use the Summary report to spot trends in activity. For example, if a client takes withdrawals at the beginning of every quarter, a Summary report can reveal that and help you proactively anticipate the need for cash the following quarter.
-
How do managed assets compare with unmanaged assets?Clearly break down managed and unmanaged performance and transactions into separate sections. If you want to compare them directly, you can add all the same data points for each. But you can also report on different data points for managed and unmanaged—for example, show only transactions and values for unmanaged assets, but including returns for managed assets.
See the Summary Report in Action: In a PDF Report
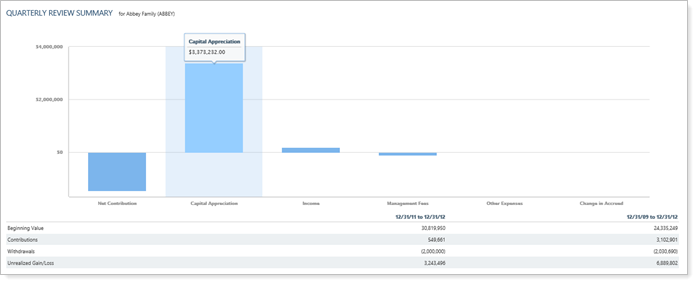
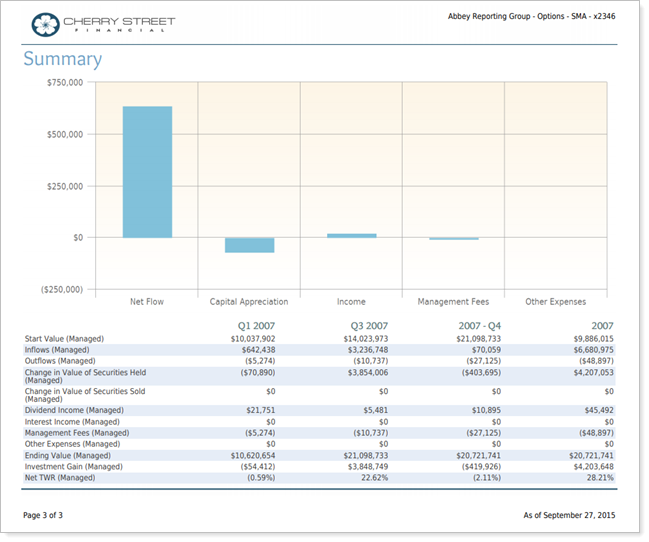
A firm includes the Summary report at the beginning of their year-end reporting package to provide an overview of what happened in the client's account over the year. They have set up the Summary report to show the four quarters of the year, adding rows that display start value, various possible transactions and flows that could impact the account value, the ending value, and some summary statistics.
See the Summary Report in Action: As a Dynamic Report
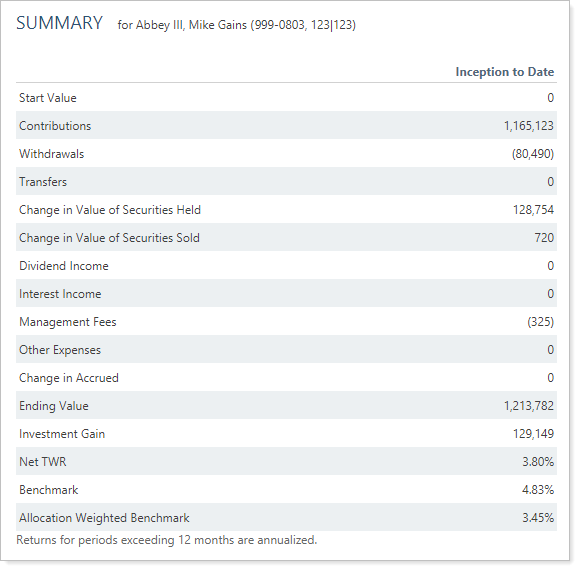
An advisor uses the Summary report for reviewing the returns in an account in comparison with the benchmark and allocated weighted benchmark. The Summary report provides context for those returns, showing what activities occurred in the account over the selected date period.
Features of the Summary Report
The Summary report helps you easily filter and sort data to drill down to meaningful results. Interactive reporting features include the following.
Create the Look You Want
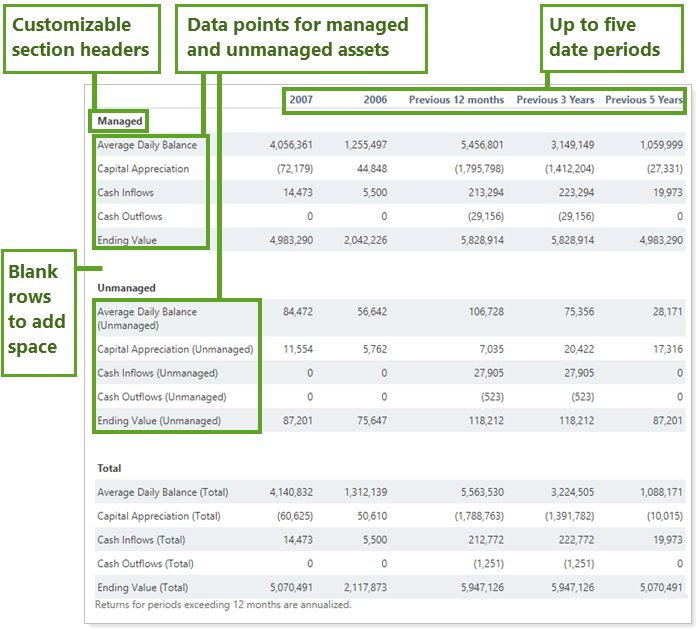
Use sub-headings and blank white rows to create separate sections and draw attention to the most important data points such as net investment gain or return numbers.
Customize Naming
You can customize the name of most selected rows and the Managed/Unmanaged labels used for the headings and captions.
Show Managed and Unmanaged Assets
Display managed, unmanaged, and total asset summary statistics side by side.
You may notice that total flows don't always match the sum of managed and unmanaged flows in some reports. This occurs when, for performance purposes, there is a flow between managed and unmanaged. When viewing the total, this flow is not needed for performance purposes and so is excluded from these aggregated numbers.
Because of this, the following flow columns may not sum to total:
|
|
For more information about marking securities as unmanaged and how reports display unmanaged assets, see:
- How Reports Handle Unmanaged Assets
- Exclude Cash or Other Securities from Performance
- Exclude From Performance/Exclude ALL Securities From Performance
Choose Data Points to Include
Select specific rows to display and compare up to five date periods side by side.
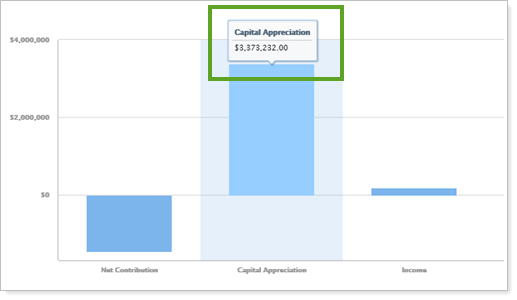
Use Tooltips to See Details
See data details by hovering over a category on the bar chart.
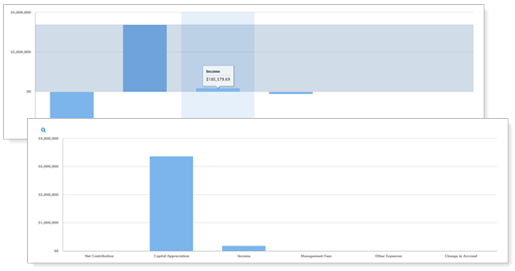
Zoom In or Out to Change the View
Zoom in by clicking and dragging to select an area. You can then scroll through the zoomed area by holding down the Shift key and dragging to the left or right. Reset your zoomed chart quickly by clicking the  button.
Identify Partial Period Returns
Identify Partial Period Returns
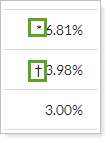
The following symbols mark partial period returns:
- Dagger symbol (†): linked partial period TWR only
- Asterisk (*): all other partial period returns (TWR and IRR)
See Date Ranges for Partial Period Returns
On dynamic reports, hover text displays both start and end dates for partial period returns. If you're using the enhanced performance calculations and there was more than one open period during the selected date range, you will see the start date of the first holding period and the end date of the final holding period.
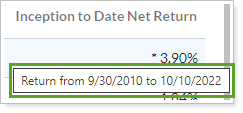
See Date Ranges for Partial Period Returns
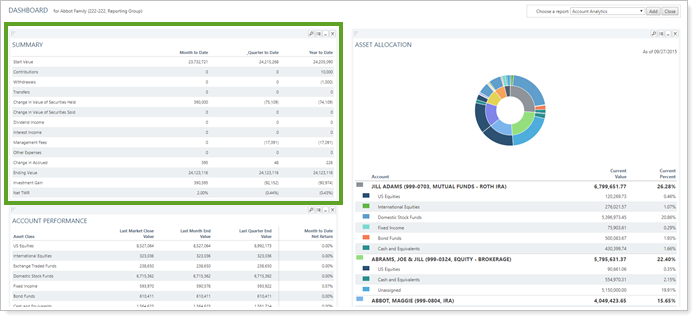
Add Summary to the Reporting Dashboard
You can use dashboard views to see a pared-down, at-a-glance summary of the main dynamic report on your dashboard.
To learn more about creating and managing dashboard views in general, see Create and Share Dashboard Views.
For more information on customizing your dashboard, visit Working With Dashboard Modules.
Summary Report Settings
The following settings are available for the Summary report. Click the setting name for more details:
| Setting | Details | Available In... | |||
|---|---|---|---|---|---|
| Dynamic Report | PDF Report | Reporting Dashboard | PDF Dashboard | ||
| Report Name | Designate a unique name for the report view. | X | X | ||
| Section Title | Designate what the section will be called in the PDF report. | X | X | ||
| Section Alignment |
Align the PDF Dashboard report to the top, middle, or bottom of the vertical space. |
X | |||
| Theme | Designate what theme the section will use. | X | |||
| Header and Footer | Choose a unique header and footer for the section or use defaults. | X | |||
| Include Page Break After This Section |
Control where page breaks occur in PDF reports. |
X | |||
| Account Grouping | Control grouping of accounts and groups. | X | |||
| Include Reports for Closed Accounts | Show sections for accounts that were closed before the report as-of date. | X | |||
| Mark as Publicly Accessible | Share the report view. | X | |||
| Select the date period you want to use for the report. | X | X | X | ||
| Use Date or Date Period as Title | Use the date (MM/DD/YYYY) as the title of the column heading, rather than the name of the date period. | X | |||
| Use Inception Date | Report partial periods in PDF reports for instances where the account or group was opened after the beginning of the date period selected. | X | X | ||
| Group Allocation Weighted Benchmark By | Designate which category of allocation weighted benchmark is used in the return calculations. | X | X | X | X |
| Annualize Returns | Report the returns as annualized returns. | X | X | X | X |
| Include Intra-Group Flows | Include or exclude intra-group flows, or display intra-group flows in the Intra-Group Flows In and Intra-Group Flows Out rows. | X | X | X | X |
| Partial Returns |
Choose how to mark data points that have partial returns. |
X | |||
| Show Actual Return Dates |
Show the actual start date for partial period returns. |
X | |||
| Show Chart | Show or hide a chart summarizing flows. | X | X | X | |
| Available/Selected Rows | Choose which rows are included, in what order. | X | X | X | X |
| Include Additional Indexes | Add the performance any of the firm's available indexes, custom indexes, or blended indexes as a data point. | X | X | ||
| Available/Selected Indexes | Add the performance any of the firm's available indexes, custom indexes, or blended indexes as a data point. | X | X | ||
Report Actions
To learn more about reports in Tamarac, see Introduction to Reports.
To learn more about how to generate a report, change the data displayed, print or export the report data, and more, see Basics of Working With Reports.
To learn more about creating and using PDF reports, see Understanding PDF Reports and Workflow: Generate a PDF Report.
Report Calculations
For information on how Tamarac calculates data points for the Summary report, see Summary Report Data Point Calculations.