
Contents
How Show Chart Works on the Summary Report
| Applies to: | ||
|---|---|---|
| ✔ Dynamic |
✔ Client Portal |
|
On the Summary report, Show chart displays the following five pre-determined data-points from your portfolio accounting system:
-
Capital appreciation
-
Income (both interest and dividend)
-
Management fees
-
Net contributions
-
Other expenses
The date period for the Summary report chart is set by the first date period selected.
In Dynamic Reports
This setting allows you to show or hide a summary bar graph.
-
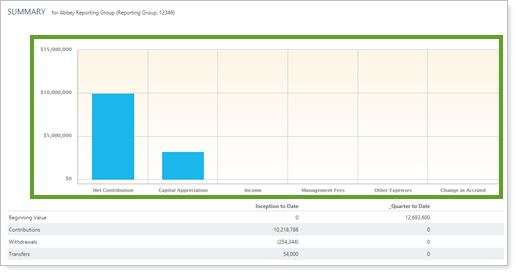
To see the bar chart, select Show chart.
A bar chart with five predetermined data fields is displayed above the summary table.
-
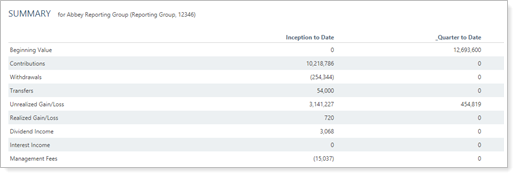
To hide the bar chart, clear Show chart.
The summary table is displayed by itself.
In PDF Reports
Functionality is the same in the PDF report templates as in dynamic reports.
Reports With This Setting
Performance ReportsRelated Settings
For more information about setting up how charts look in dynamic reports, see Site Themes. For more information about setting up PDF template themes, see Understanding PDF Themes.
The following settings are related: