
Contents
How Show Chart Works on the Projected Income Report
| Applies to: | ||
|---|---|---|
| ✔ Dynamic |
✔ Client Portal |
|
On the Projected Income report, you can choose to show or hide a summary bar chart. The decision to do so depends on what you're trying to achieve with the report. The bar chart can provide a helpful visual summary of received and projected income, but may not be helpful for detailed income analyses.
In Dynamic Reports
This setting allows you to show or hide a summary bar graph. What the chart shows varies by report.
-
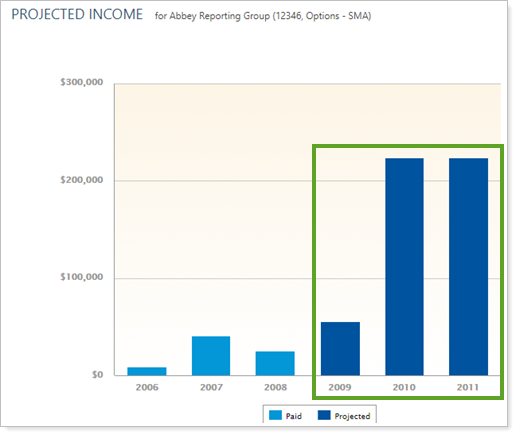
To see the bar chart, select Show chart. The report displays data for each of the time periods selected.
A bar chart with summarizing the projected income for each date period is displayed above the table.
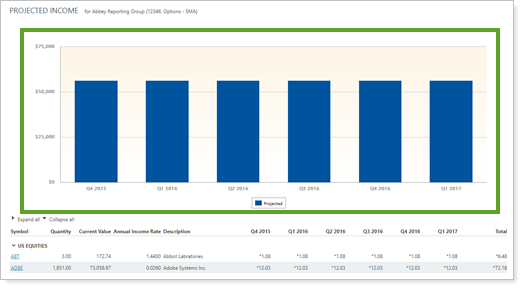
Depending on your site theme settings, paid income and projected income are displayed differently on the chart so you can differentiate income already received and income yet to be received.
-
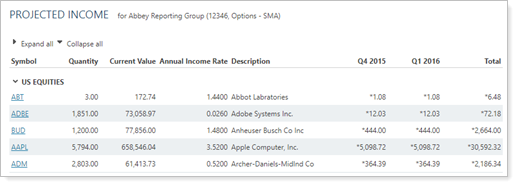
To hide the bar chart, clear Show chart.
The projected income table is displayed by itself.
In PDF Reports
Functionality is the same in the PDF report templates as in dynamic reports.
Reports With This Setting
Transaction Reports
Related Settings
For more information about setting up how charts look in dynamic reports, see Site Themes. For more information about setting up PDF template themes, see Understanding PDF Themes.
The following settings are related: