
Contents
How Show Table or Bar Chart Works
| Applies to: | ||
|---|---|---|
| Dynamic |
Client Portal |
|
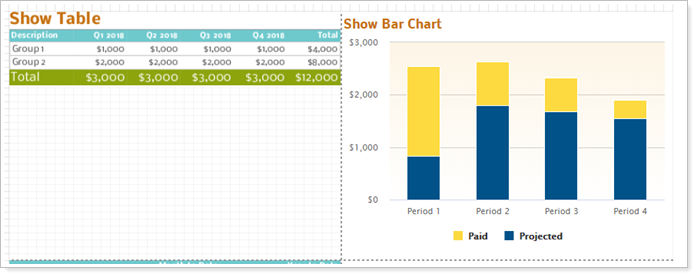
Many of our reports offer a variety of ways to visually display data. On the PDF Dashboard section, you can choose to display the Projected Income report panel as a table or bar chart, depending on whether you want to provide a more numerical summary or a more visual summary.
For more information about the Projected Income report and its settings, see Projected Income Report.
In Dynamic Reports
This setting is only available in the Projected Income section of the PDF Dashboard.
In PDF Reports
-
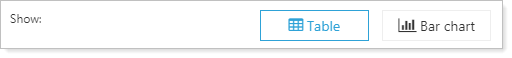
To show a table in the PDF Dashboard section, click Table. You can group by category with the Table option.
-
To show a bar chart in the PDF Dashboard section, click Bar chart.
Reports With This Setting
PDF-Specific ReportsTransaction Reports
-
Projected Income (PDF Dashboard only)
Related Settings
The following setting is related: