
Contents
Introduction
| Applies to: | |||
|---|---|---|---|
| ✔ Dynamic | Mobile | ✔ Client Portal | |
This report provides data on expected income from dividends, principal repayments, and coupons.
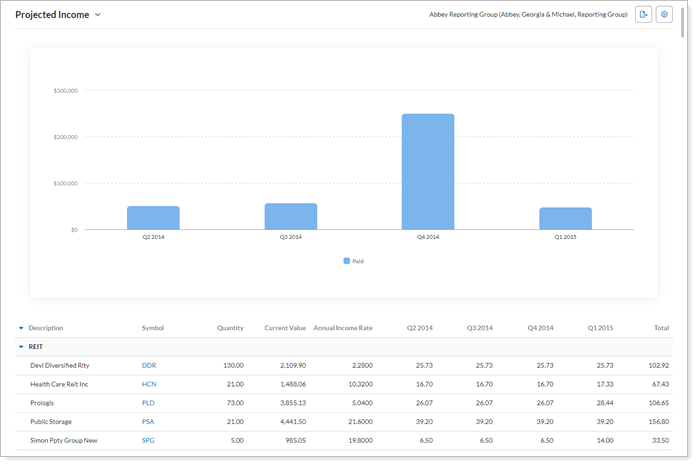
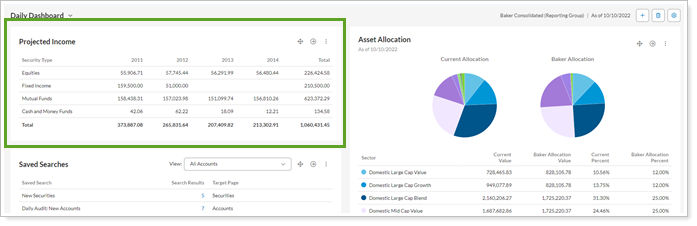
The Projected Income report displays a table and an optional bar chart for a sequential list of periods. The portfolio securities are listed line-by-line in the table along with the actual or expected payment received in each period. Totals are aggregated by category for each period. The bar chart provides a visual representation of the overall paid and projected income for each date period.
Projected income is classified into five categories:
-
Payments.Income typically received from equity dividends or fixed income coupons. Payments can be projected. For information on how Tamarac calculates future payments, see Future Payment Calculations on the Project Income Report.
-
Reinvested Income.Payments that are retained in the investment. Reinvested income is only projected for mutual funds.
-
Principal Redemptions.The return of an investor's principal. Principal redemption is projected for fixed income and CDs.
-
Gain Distributions.Capital gains distributed to mutual fund shareholders from the underlying investment portfolio. Gain distributions are never projected.
-
Return of Principal.A return of the original capital invested. It is not income. Return of principal will typically occur on mortgage-backed securities. Return of principal is never projected.
Why Use the Projected Income Report?
In the Projected Income report, you will find versatile sorting and charting options that let you answer many income-related questions about accounts and groups, such as:
-
How Much Income Will This Account Generate Over the Next 4 Quarters? Evaluate the amount of income generated by each security in accounts or groups over a number of date periods you select.
Unlike many transaction reports where you choose a date period, for this report you choose a starting date and a number of periods you want to project out to. For example, you can choose to break it down by month and show 6 months, or by quarters and show only 3 quarters. For more information, see Show Data in X for Y Time Periods.
-
How Much Income Did a Certain Security Type Generate?See income for all the securities in the account or limit the report to only specific types of securities, such as equities, fixed income, mutual funds, and more.
See the Projected Income Report in Action
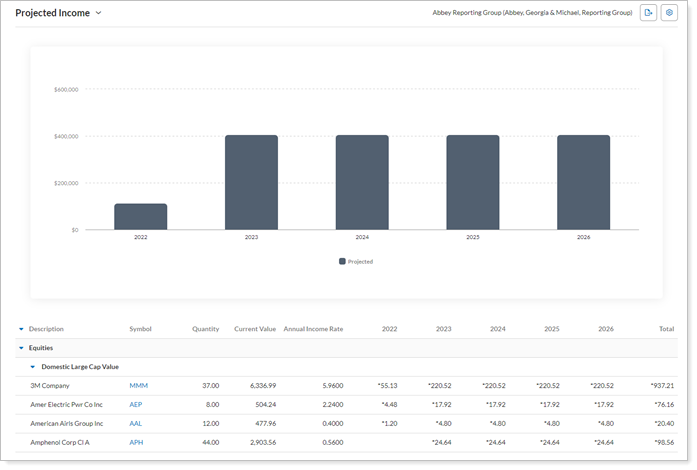
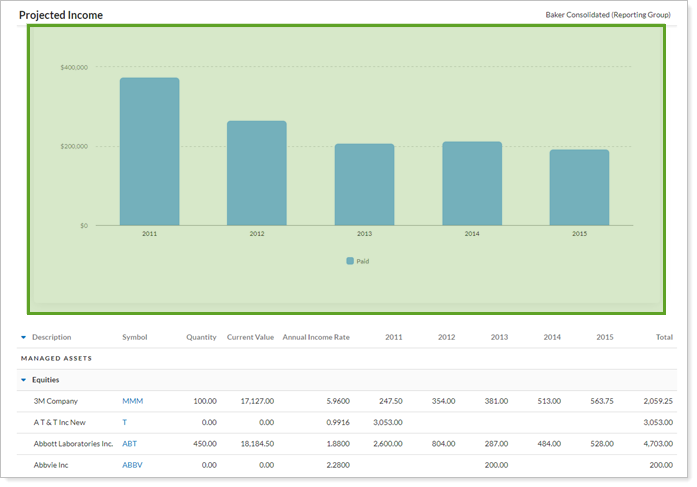
An advisor is financial planning with a client and wants to plan for future incomes and prepare for possible tax implications, depending on the income source.
The advisor uses a Projected Income report to look at the client's taxable accounts for the next five years. The chart provides a broad overview of the income expected to receive, and the table, sorted by equity type, helps the advisor drill into the income source and possible tax repercussions.
Features of the Projected Income Report
The dynamic report helps you easily filter and sort data to drill down to meaningful results. Interactive reporting features include the following.
Customize Data and Display
Display only relevant data. You control what data are displayed and which columns are included, in what order, so you can create the exact report you need.
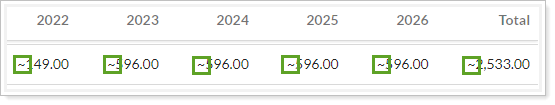
For example, use the character of your choice to mark paid or projected income for easier differentiation in the table. This is especially useful if the report start date is in the past. It helps you distinguish income already paid with projected income. For more information, see Mark Projected/Paid With.
Filter Data
Powerful filtering lets you see only relevant data points for the designated securities. Control how much detail you see—anything from all securities or transaction types to just one specific type.
Use Tooltips to See Details
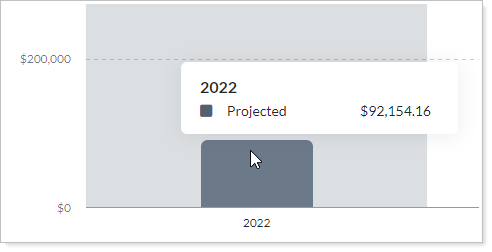
Hover over a bar to see a tooltip and details for that data point.
Customize Data on the Fly
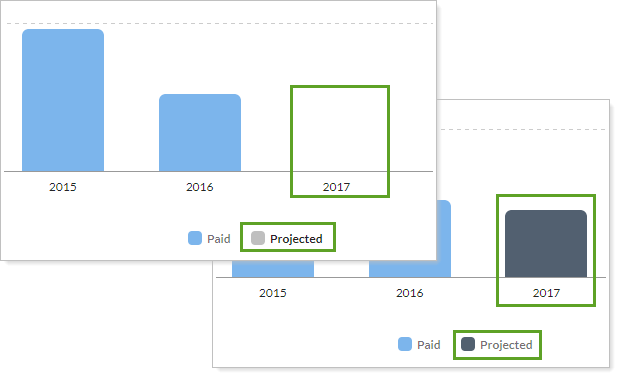
Click data points in the chart legend to show/hide data points.
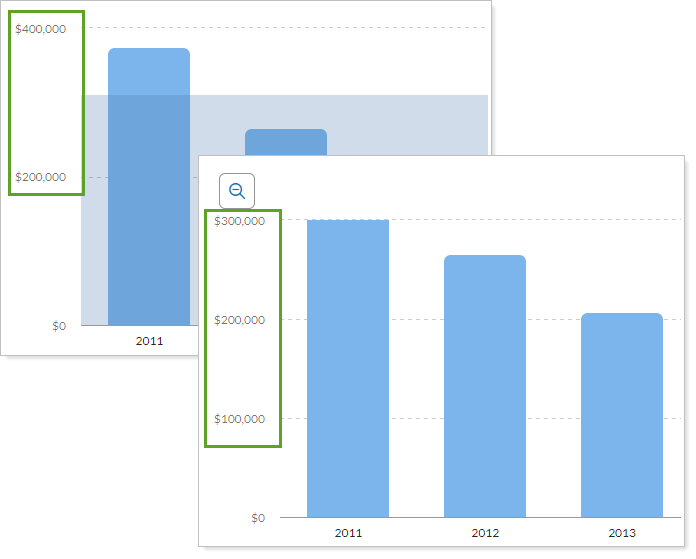
Zoom In or Out to Change the View
Zoom in on the allocation over time chart by clicking and dragging to select an area. You can then scroll through the zoomed area by holding down the Shift key and dragging to the left or right. Reset your zoomed chart quickly by clicking the  button.
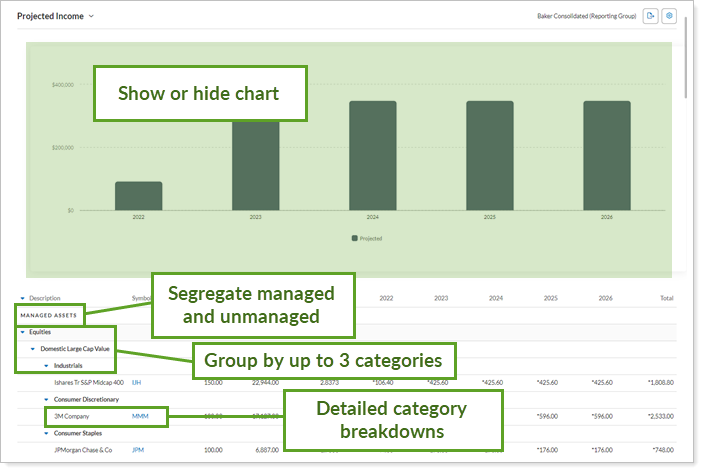
Show or Hide Report Sections
View a bar chart of income for the date periods selected, or see only the detailed table. For more information, see Show Chart.
Expand or Collapse Rows
Expand (>) or collapse (˅) table rows to further control the level of detail.
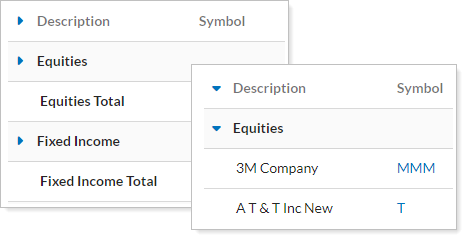
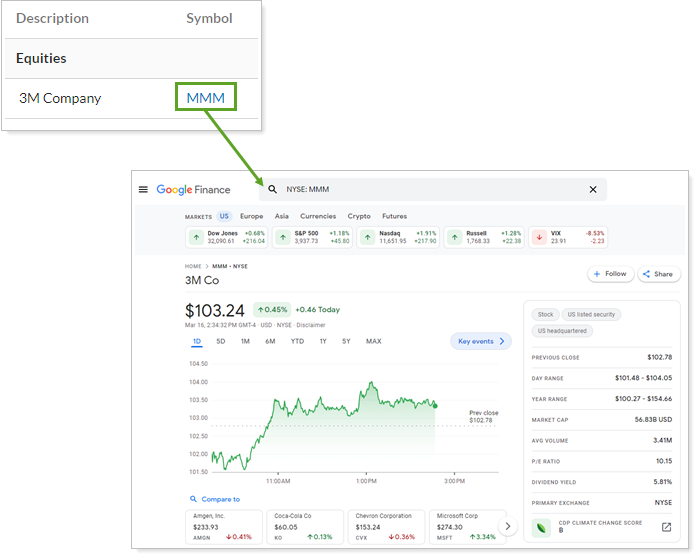
View Security Details
Click the name of a security to view Google Finance information about that security.
You can enable or disable ticker links for each security type.
Include Managed and Unmanaged Assets
Display managed, unmanaged, and total side by side.
For more information about marking securities as unmanaged and how reports display unmanaged assets, see:
- How Reports Handle Unmanaged Assets
- Exclude Cash or Other Securities from Performance
- Exclude From Performance/Exclude ALL Securities From Performance
Add Projected Income to the Reporting Dashboard
You can use dashboard views to see a pared-down summary of the main dynamic report at a glance on your dashboard.
To learn more about creating and managing dashboard views, see Create and Share Dashboard Views.
For more information on customizing your dashboard, visit Working With Dashboard Modules.
Projected Income Report Settings
The following settings are available for the Projected Income report. Click the setting name for more details.
| Setting | Details | Available In... | |||
|---|---|---|---|---|---|
| Dynamic Report | PDF Report | Reporting Dashboard | PDF Dashboard |
||
| Report Name | Designate a unique name for the report view. | X | X | ||
| Mark as Publicly Accessible | Share the report view. | X | |||
| Section Title | Designate what the section will be called in the PDF report. | X | X | ||
| Theme | Designate what theme the section will use. | X | |||
| Header and Footer | Choose a unique header and footer for the section or use defaults. | X | |||
| Include Page Break After This Section |
Control where page breaks occur in PDF reports. |
X | |||
| Account Grouping | Control grouping of accounts and groups. | X | |||
| From Date | Manually set a start date for the report. | X | X | X | X |
| Show Data in X for Y Time Periods |
Designate the time period for which you want to run the Projected Income report and how many iterations of that period are displayed. On the Dashboard report, the Time Periods option is not available. |
X | X | X | X |
| Group By/Then By |
Organize a report by various categories. |
X | X | X | X |
| Show Subtotals |
Add subtotals to each grouping level when you Group by. |
X | X | ||
| Sort By | Determine the default order in which the data is displayed. | X | |||
| Unmanaged Asset Treatment |
Choose how you want to treat unmanaged assets. |
X | X | ||
| Mark Projected With/Mark Paid With | Set how you want to label projected and paid income. | X | X | X | |
| Combine Group Positions |
Combine any common positions held within a selected group. |
X | X | ||
| Report SMAs as a Single Line Item | Choose how you want to see SMAs in the report. | X | X | X | X |
| Report Security Groups as a Single Line Item | Choose how you want to see security groups in the report. | X | X | X | X |
| Include the Following Security Types | Designate what securities are included in the report. | X | X | X | X |
| Include the Following Transaction Types | Designate what transactions are included in the report. | X | X | X | X |
| Show Chart | Show or hide a chart summarizing income and expenses. | X | X | ||
| Available/Selected Columns | Choose which columns are included and in what order. | X | X | ||
| Preview |
See a sample of added columns or rows with the selected settings. |
X | |||
| Show Table or Bar Chart | Choose whether the PDF Dashboard section displays a table or a bar chart. | X | |||
Report Actions
To learn more about reports in Tamarac, see Introduction to Reports.
To learn more about how to generate a report, change the data displayed, print or export the report data, and more, see Basics of Working With Reports.
To learn more about creating and using PDF reports, see Understanding PDF Reports and Workflow: Generate a PDF Report.