
Contents
How Show Bar Chart Works
| Applies to: | ||
|---|---|---|
| ✔ Dynamic |
✔ Client Portal |
|
Many of our reports offer a variety of ways to visually display the data. One option you'll see on several reports is the ability to see the data as a bar chart.
The Show bar chart setting allows you to add a bar chart on the report, and depending on the report type, you can control a variety of characteristics about the chart.
When using a bar chart on performance reporting, most often you'll include benchmarks in the chart to compare returns side by side.
In Dynamic Reports
-
To see the bar chart, select Show bar chart. On the Account Performance report, choose whether you would like to show return or net investment gain. Only the periods with return types matching your choice for that chart will be displayed. If all the Show return options are set to the same type for all date periods, the bar chart return type will be set to match.
-
To hide the bar chart, clear Show bar chart.
Account Performance Report
When using a bar chart in performance reporting, most often you'll include benchmarks in the chart to compare returns side by side.
When you select the Show bar chart check box on the Account Performance report, the following settings apply:
-
Show Category/Account Returns. Use this setting to include or exclude returns for the category selected or for accounts.
-
Include ___ Categories/Accounts. Use this setting to designate how many categories or accounts you see on the bar chart.
-
Show: Return or Net Investment Gain. Use this setting to determine how you display performance. The Show return or investment gain setting determines your options for showing return or net investment gain.
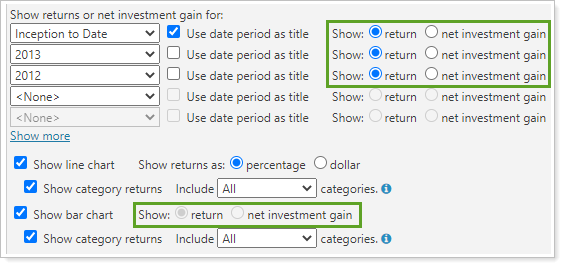
Example: All the Same Return Options
For example, when you set all the date periods to the same return option...
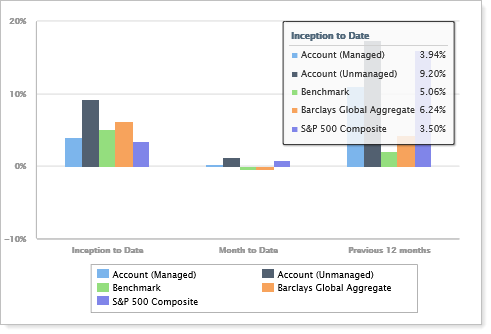
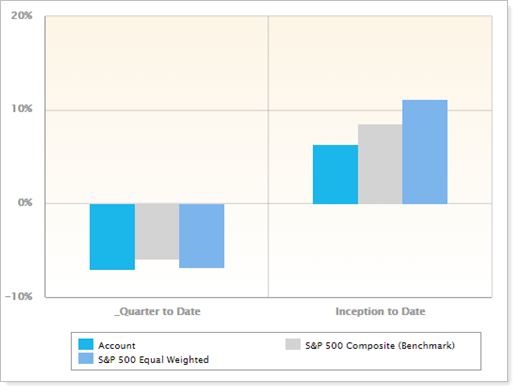
...you see this bar chart:
The bar chart Show return or net investment gain option is disabled and the bar chart displays returns for all date periods as a percentage.
Notice that the chart shows benchmarks, which you can add using Include Benchmarks.
Example: different Return Options
When all the date periods are set to show a mix of returns and net investment gain...
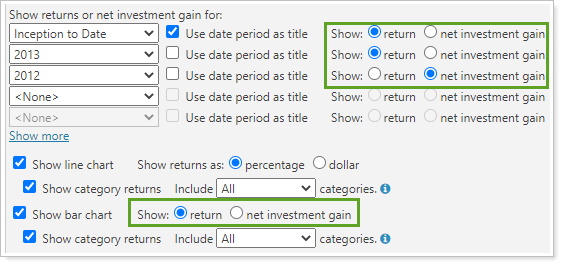
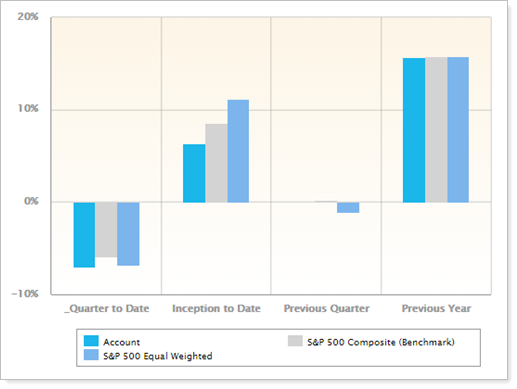
...you see this bar chart:
If you choose to show return, the bar chart displays only the date periods set to return.
In this example, benchmarks have been added for comparison with the account. To learn more about benchmarks, see Benchmarks.
Bond Analysis Report
When you select Show bar chart on the Bond Analysis report, the following settings appear:
In PDF Reports
Functionality is the same in the PDF report templates as in dynamic reports.
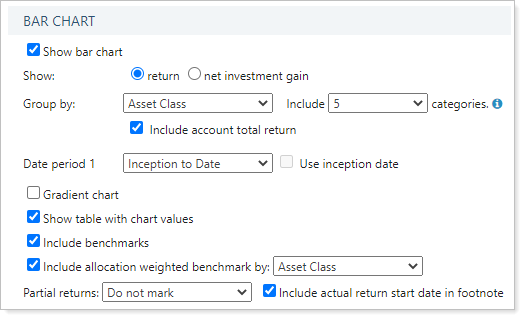
Account Performance Report
The following settings are available in PDF Account Performance reports when you select Show bar chart.
Bond Analysis Report
All the same settings are available and behave the same in the PDF Bond Analysis report.
Reports With This Setting
Performance ReportsHoldings Reports
Related Settings
For more information about setting up how charts look in dynamic reports, see Site Themes. For more information about setting up PDF template themes, see Understanding PDF Themes.
The following settings are related: