
On the Bond Analysis bar chart, this setting allows you to choose how many years are displayed when the primary axis is set to year.
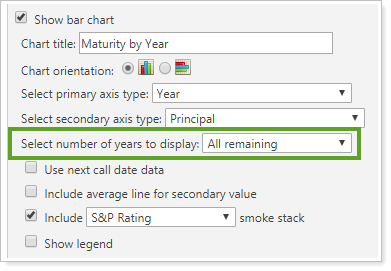
You can choose from the following:
-
All remaining
-
5 years
-
6 years
-
7 years
-
8 years
-
9 years
-
10 years
-
11 years
-
12 years
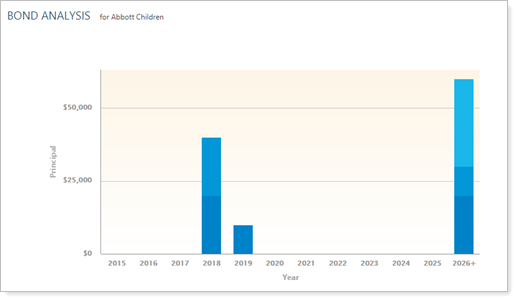
For example, if you set Select number of years to display to All remaining, the chart includes as many years in the primary axis as required to show all bond maturity dates.
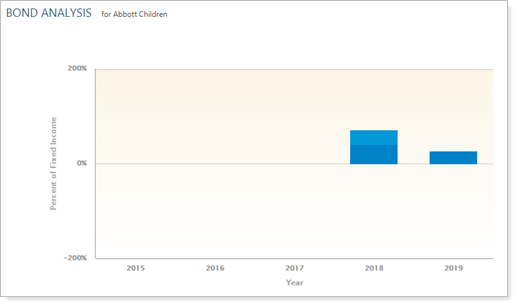
If you set Select number of years to display set 5 years, the selected number of years will be shown in the primary axis, regardless of maturity dates. This example shows 5 years, but the behavior remains the same as you choose any range from 5 years to 12 years.
This setting applies to the Bond Analysis report. For more information on using the Bond Analysis bar chart, see Show Bar Chart.