
Contents
How Show Table With Chart Values Works
| Applies to: | ||
|---|---|---|
| Dynamic |
Client Portal |
|
This setting allows you to show or hide a table that summarizes the data displayed visually in the associated chart. It is available in the Account Performance PDF report when you include a bar chart or a line chart.
You might use this depending on the layout of your report and what is displayed in the rest of the section. If the full performance values are displayed in a table elsewhere, you might exclude it. Otherwise, the table adds context to the chart.
In Dynamic Reports
This setting is not available for dynamic reports.
In PDF Reports
-
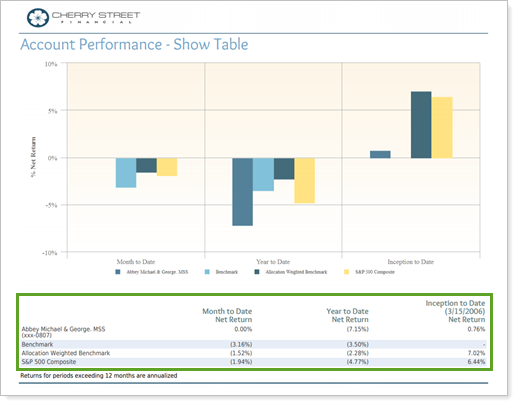
To see the table, select Show table with chart values. This option is selected by default.
A summary table appears beneath the chart on the page. The columns match the date periods set for the chart.
-
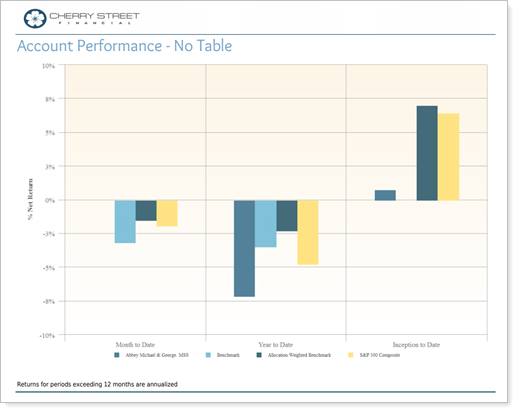
To hide the table, clear Show table with chart values. The chart is shown by itself on the page.
Reports With This Setting
Performance ReportsRelated Settings
For more information about date periods, see Dates and Date Periods. For more information about themes, see Site Themes and Understanding PDF Themes.The following setting are related: