 Back
Back|
Back |
|
Account Performance Report
| Applies to: | |||
|---|---|---|---|
| ✔ Dynamic | ✔ Mobile | ✔ Client Portal | |
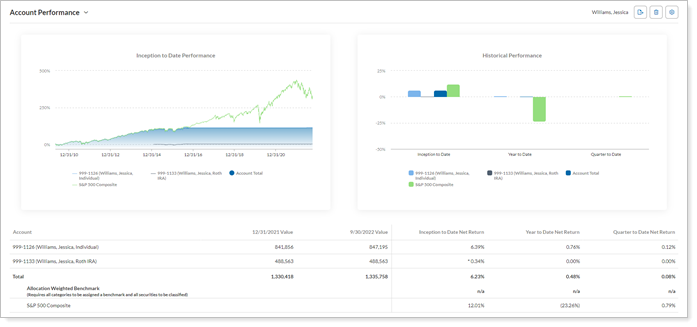
The Account Performance report shows account values and performance data to tell the story of how an account or group has performed over a designated date range. It helps you understand and troubleshoot TWR for an account or group and allows you to drill down on the performance for each account or group to view underlying holdings, categories, or accounts.
The report can include:
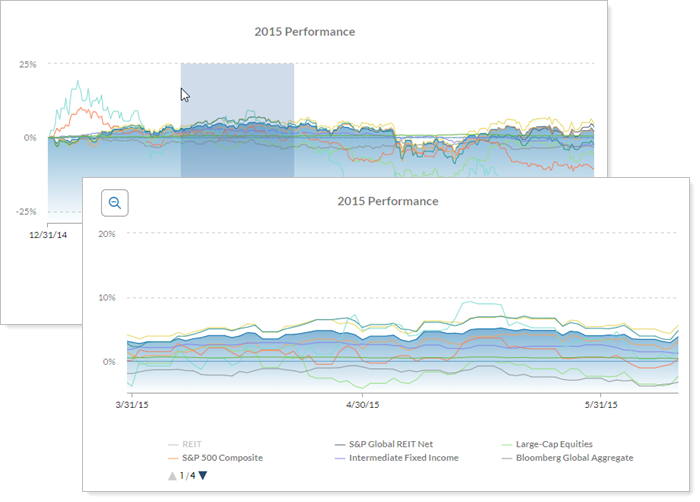
A line chart for one date period. The line chart always displays cumulative time-weighted returns (TWR).
In PDF reports, this chart is sampled at the following rates:
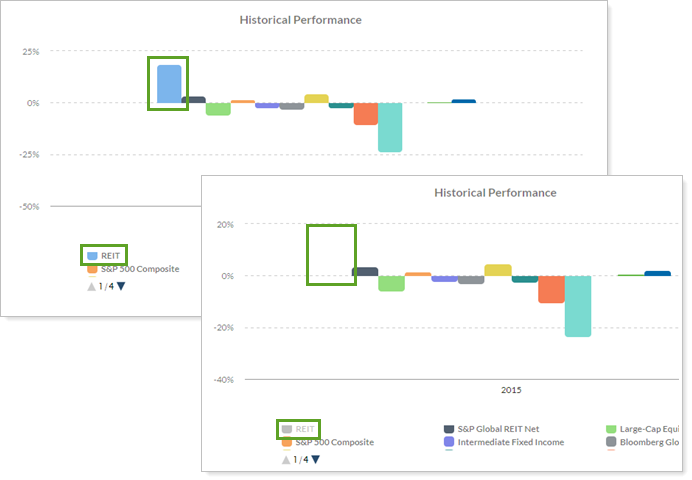
A bar chart showing up to 12 date periods.
A table including performance results for up to 12 date periods.
You can add benchmarks in both the table and chart views for easy comparison. For more information, see Add Benchmarks to the Account Performance PDF Report.
The Account Performance report provides versatile charting options that make it an effective report to lead your reporting package, addressing your clients' likely primary concern: performance. The Account Performance report answers such questions as:
How Has this Account or Group Performed Over Time? Use the report to see an overview of account performance over designated time ranges.
How have different security types performed over this date period?Group by your firm's security categories to see performance results for all the categories held in the account or group.
How does the group's performance compare with its direct member accounts?Run the report on a group and include direct member accounts or groups for direct comparison.
How has This Account Performed Compared with the Benchmark?Compare the performance of the account or group with the assigned benchmark, with side-by-side charts and data points.
How Have Different Categories or Positions Performed within the Account?Drill into performance details of various categories or positions within an account or group.
Cherry Street Financial knows that the first thing clients look for in PDF reports is how their accounts are performing under Cherry Street's management. That's why Cherry Street includes an Account Performance section near the beginning of many of their PDF report templates. The section is configured to display performance for all accounts within the client's group as a broad overview of performance.
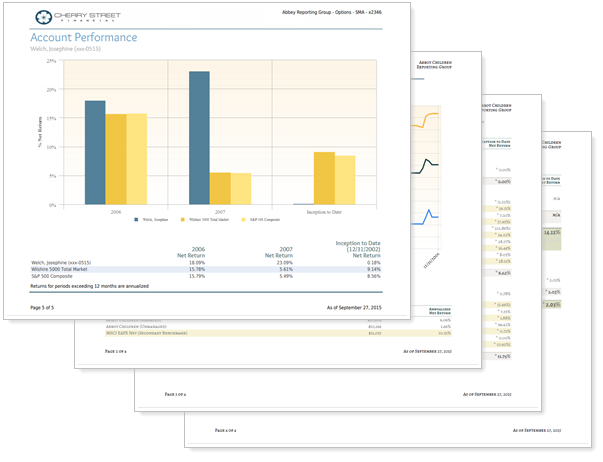
The remainder of the PDF template then follows up with detailed account performance for each account.
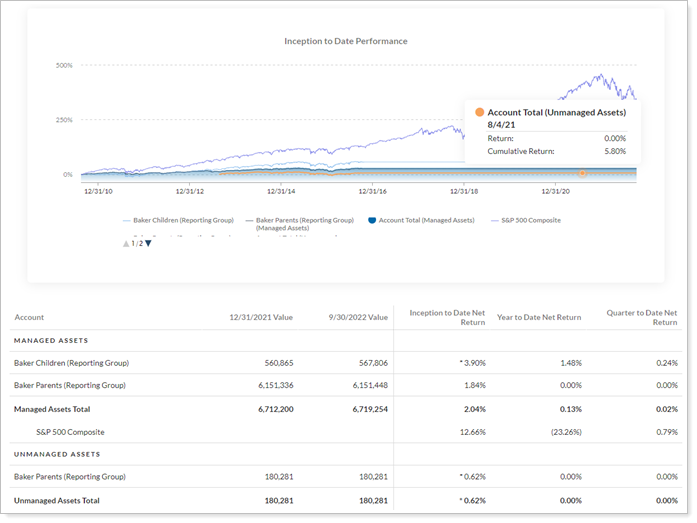
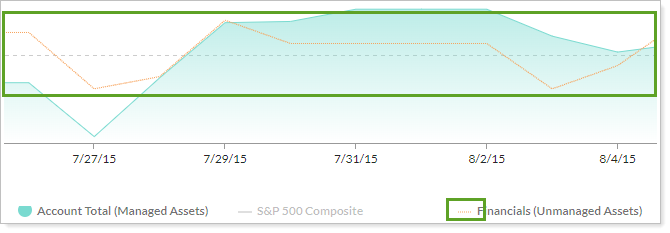
An advisor has a group that includes managed and unmanaged accounts. When the client calls and asks about overall performance, the advisor uses an Account Performance report that splits out managed and unmanaged assets so he can address only the performance of accounts under his control.
The report clearly shows that performance of the unmanaged account lags noticeably compared to managed accounts, and the advisor uses this opportunity to suggest moving those assets under his management as well.
An advisor is interested in showing clients how their accounts did within their group and then showing how each category in the accounts performed. The advisor creates two Account Performance PDF report sections.
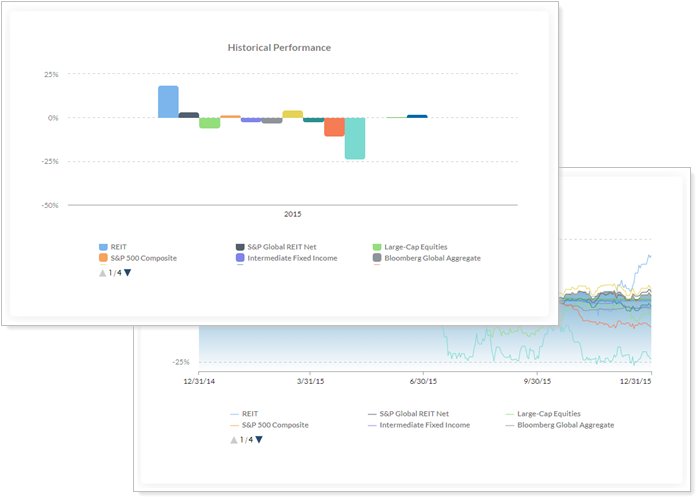
One section shows a line chart of the group performance compared with all the direct member accounts and groups in the group, with account benchmarks displayed when available.
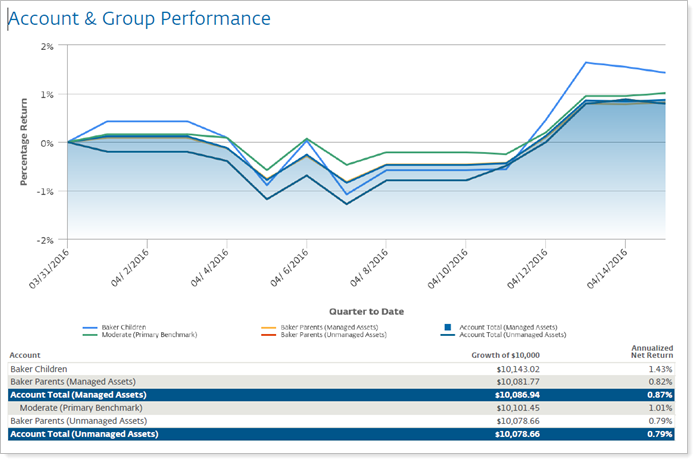
The other section shows a bar chart of all the categories held in the group for the one date period of interest, with category benchmarks for reference.
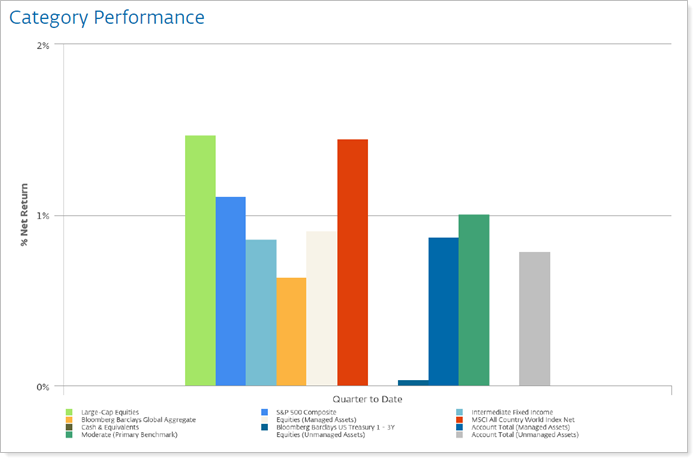
With these two charts, the advisor quickly and clearly tells the story of how the client's accounts and underlying asset classes performed over the period.
The dynamic report helps you easily filter and sort data to drill down to meaningful results. Interactive reporting features include the following.
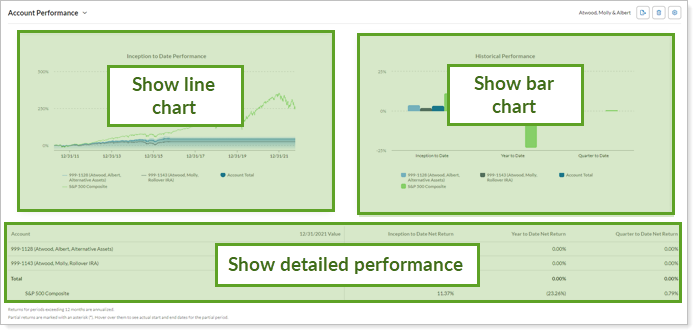
The Account Performance report offers three sections: a line chart, bar chart, and a detailed performance table. Depending on your reporting needs, you can include or exclude any of those sections.
The table is always displayed in the dynamic report. You can include or exclude it on the PDF report.
In PDF reports, rows for accounts, groups, or categories that do not include data will be dropped from tables if you're using the enhanced performance calculations.
Use the report to compare overall group performance with the performance of its direct member accounts or groups, or add categories to the report to see account or group returns for underlying holdings like security type, sector, subsector, and more.
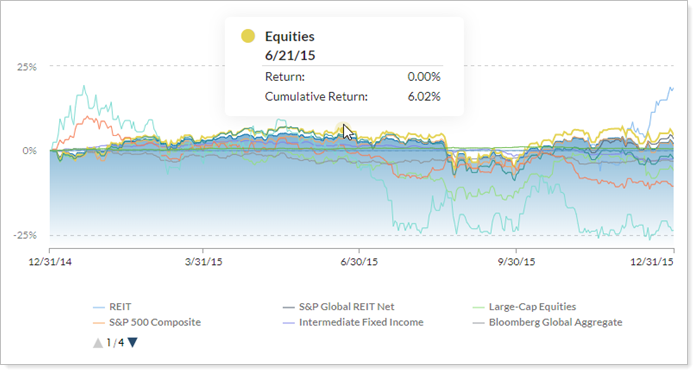
Hover over a category on the chart to see a tooltip showing details for that data point.
Click items in chart legends to show or hide data points.
Zoom in on the chart by clicking and dragging to select an area. You can then scroll through the zoomed area by holding down the Shift key and dragging to the left or right. Reset your zoomed chart quickly by clicking the  button.
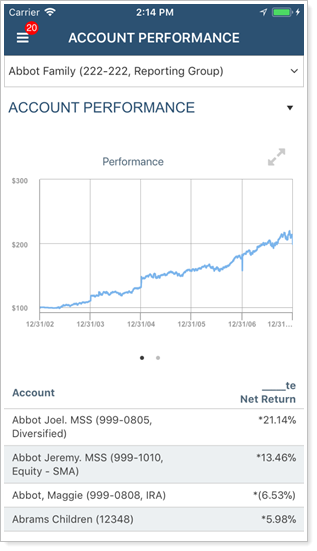
The report is optimized for mobile viewing, making it easy to use on any device, anywhere. To learn more about mobile app report features, see Mobile App Reports.
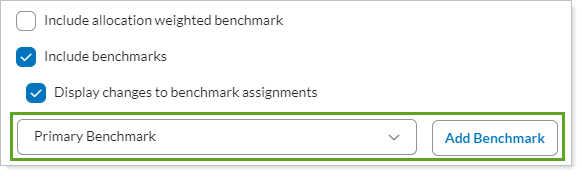
On the Account Performance PDF report, adding benchmarks to the bar chart and line chart is a two-step process. To add benchmarks:
Select Include Benchmarks.
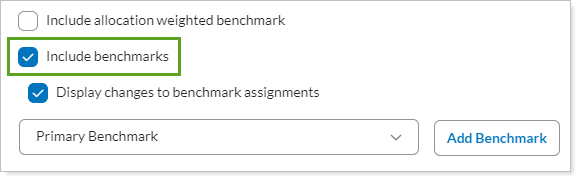
In Selected Benchmarks, select the benchmark you want to add and click Add Benchmark.
Display managed, unmanaged, and total performance results side by side. When you segregate unmanaged accounts from managed accounts, you'll see the unmanaged returns marked on charts with shaded bars or dotted lines.
You may notice that total flows don't always match the sum of managed and unmanaged flows in some reports. This occurs when, for performance purposes, there is a flow between managed and unmanaged. When viewing the total, this flow is not needed for performance purposes and so is excluded from these aggregated numbers.
Because of this, the following flow columns may not sum to total:
|
|
For more information about marking securities as unmanaged and how reports display unmanaged assets, see:
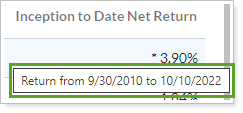
As you look at direct member accounts in groups, it's likely you'll see some accounts that opened after the date period started, closed before the date period ended, or had times when the account had a value of $0 and had no returns.
The following symbols mark partial period returns on the table:
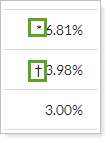
On dynamic reports, hover text displays both start and end dates for partial period returns. If you're using the enhanced performance calculations and there was more than one open period during the selected date range, you will see the start date of the first holding period and the end date of the final holding period.
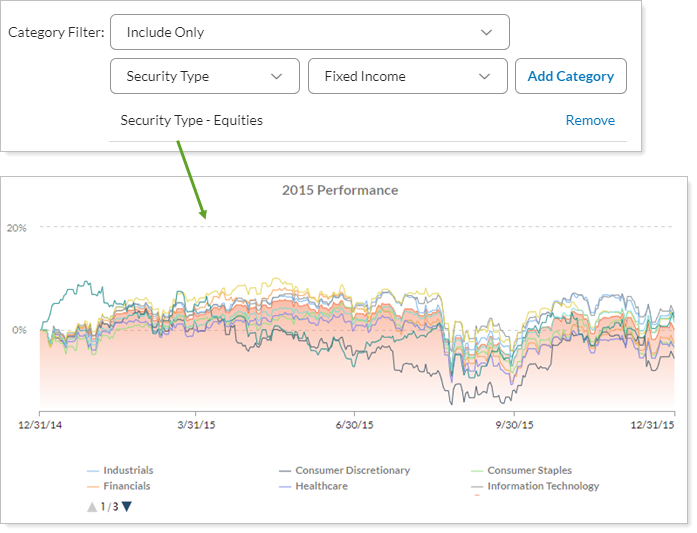
You might want to filter this report to include certain categories or exclude them to drill down into performance for the account or group. By using a category filter, you can specify specific categories to include in the report or specifically exclude categories.
You can use dashboard views to see an at-a-glance summary of the dynamic Account Performance report on your Reporting dashboard.
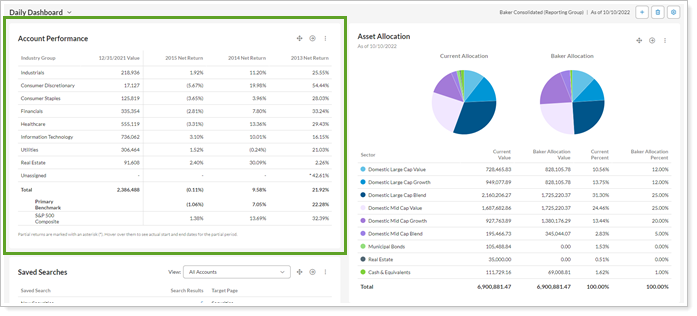
To learn more about creating and managing dashboard views, see Create and Share Dashboard Views.
For more information on customizing your dashboard, visit Working With Dashboard Modules.
The following settings, displayed alphabetically, are available for the Account Performance report. Click the setting name for more details.
| Setting | Details | Available In... | |||
|---|---|---|---|---|---|
| Dynamic Report | PDF Report | Reporting Dashboard | PDF Dashboard | ||
| Account Grouping | Control grouping of accounts and groups. | X | |||
| Annualize Returns | Report the returns as annualized returns. | X | X | X | X |
| Available/Selected Columns | Choose which columns are included and in what order. | X | X | ||
| Axis Scale | Customize the scale of the y axis. | X | X | ||
| Category Filter | Choose to include or exclude specific categories from the report. | X | X | X | X |
| Combine Group Positions |
Combine any common positions held within a selected group. |
X | |||
| Dashboard Benchmark | Determine whether an account benchmark is displayed on the dashboard widget and which benchmark is displayed. | X | X | ||
|
Select the date period for the report. |
X | X | |||
| Display Changes to Benchmark Assignments | Mark on the line chart when benchmarks applied to an account were changed. | X | X | X | |
| Gradient Chart |
Show PDF chart with a gradient. |
X | |||
| Group By/Then By |
Organize a report by various categories. |
X | |||
| Group By | Choose to see account or category data on the report. | X | X | X | X |
| Header and Footer | Choose a unique header and footer for the section or use defaults. | X | |||
| Hide Closed Accounts | Show or hide closed accounts. | X | X | X | |
| Include ___ Categories/Accounts | Set how many accounts or categories to display on the chart. | X | X | X | |
| Include Total Return | Show or hide account or group data, including benchmarks and indexes, on charts. | X | X | ||
| Include Actual Return Start Date In Footnote | Add actual return dates in the footnote. | X | |||
| Include Additional Indexes | Add the performance of any of the firm's available indexes, custom indexes, or blended indexes as a data point. | X | X | ||
| Include Allocation Weighted Benchmark | Add the allocation weighted benchmark as a data point for comparison. | X | X | ||
| Include Allocation Weighted Benchmark By | Add the allocation weighted benchmark for a specific category as a data point for comparison. | X | X | ||
|
Add one or more of the category or account benchmarks as a data point for comparison. When you want to include benchmarks, you select benchmarks from the list and add them to the report. The report displays these for accounts and groups, including SMAs. |
X | X | X | X | |
| Include Page Break After This Section |
Control where page breaks occur in PDF reports. |
X | |||
| Include Reports for Closed Accounts | Show sections for accounts that were closed before the report as-of date. | X | |||
| Mark as Publicly Accessible | Share the report view. | X | |||
| Only Show Returns for Assets Held at the End of the Period | Choose whether assets that were held during a selected period are shown when you expand a group. | X | X | ||
| Partial Returns |
Choose how to mark data points that have partial returns. |
X | |||
| Preview |
See a sample of added columns or rows with the selected settings. |
X | |||
| Report Name | Designate a unique name for the report view. | X | X | ||
| Section Alignment |
Align the PDF Dashboard report to the top, middle, or bottom of the vertical space. |
X (Table only) | |||
| Section Title | Designate what the section will be called in the PDF report. | X | X | ||
| Show Actual Return Dates |
Show the actual start date for partial period returns. |
X | |||
| Show Bar Chart | Show or hide the performance bar chart. | X | X | ||
| Show Category/Account Returns | Choose what data to show on the line or bar chart. | X | |||
| Show Data As | Set what type of data the PDF Dashboard section displays. | X | |||
| Show Detailed Performance |
Show or hide the performance table on the PDF report, and customize what the table displays. In the detailed performance table for the Account Performance PDF section, columns available are weight, description, and value. |
X | |||
| Show Line Chart |
Add the line chart to the report. |
X | X | ||
| Show Performance For | Show an account or group's performance, or just the performance for an index or indexes. | X | X | X | |
| Show Return or Net Investment Gain | Report performance as a percent return or as net investment gain. | X | X | X | X |
| Show Returns As Percentage or Dollar | Show returns as a percentage or a dollar amount on the line chart. | X | X | X | |
| Show Returns As Net or Gross |
Determine how returns should appear on the report. |
X | X | X | X |
|
and |
Configure which dates or date periods appear as columns on the report. The report displays categories only if they have value at time during any of the date periods added to the report. |
X | X | X | |
| Show Subtotals |
Add subtotals to each grouping level when you Group by. |
X | |||
| Show Table With Chart Values | Show or hide a summary table. | X | |||
| Theme | Designate what theme the section will use. | X | |||
| Unmanaged Asset Treatment |
Choose how you want to treat unmanaged assets on the report. |
X | X | X | X |
| Use Date or Date Period as Title | Use the date (in MM/DD/YYYY format) as the title of the column heading, rather than the name of the date period. | X | X | ||
| Use Inception Date | Report partial periods in PDF reports for instances where the account or group was opened after the beginning of the date period selected. | X | X | ||
| When Expanding a Group, Show |
Report on securities or accounts within the group, or to not expand groups. |
X | |||
| Within Each Group, Show | Determine what data to display as sub-categories under the main Group by rows. | X | |||
| Y-Axis Label | Set what you want to call the y axis. | X | |||
To learn more about reports in Tamarac, see Introduction to Reports.
To learn more about how to generate a report, change the data displayed, print or export the report data, and more, see Basics of Working With Reports.
To learn more about creating and using PDF reports, see Understanding PDF Reports and Workflow: Generate a PDF Report.