Back
Back Home > Tamarac Reporting > Clients and Client Portals > Client Portals > Setting Up Client Portals > Client Views > Client Views Pages > Arrange and Format Dashboard Tiles on the Dashboard Page
|
Back |
Home > Tamarac Reporting > Clients and Client Portals > Client Portals > Setting Up Client Portals > Client Views > Client Views Pages > Arrange and Format Dashboard Tiles on the Dashboard Page
|
Arrange and Format Dashboard Tiles on the Dashboard Page
|
Add, Remove, and Arrange Dashboard Tiles Change the Background and Text Color of a Dashboard Tile |
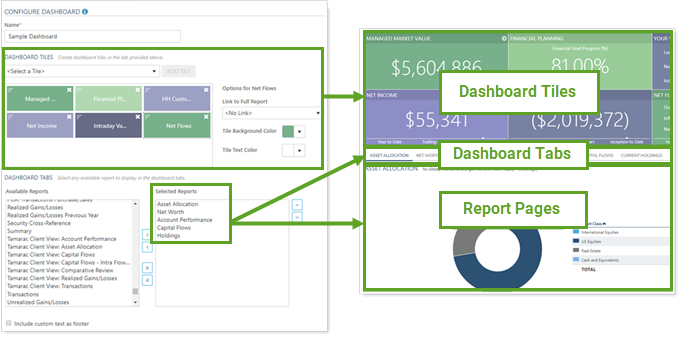
The dashboard is the landing page when your clients visit Tamarac Reporting. It shows the information that you share with your client and consists of the following elements:
Dashboard tiles. This topic provides more information about using dashboard tiles.
Dashboard Tabs and Report Pages. For more information about dashboard tabs and report pages, see Add Dashboard Tabs and Report Pages on the Dashboard Page.
Disclosures. You can add custom text to the footer of your dashboard. You can use this space to add compliance statements, disclaimers, footnotes, and any other information you want your client to see when signing into the client portal. For more information, see Add Custom Footer to the Dashboard Page.
For more information on the client portal dashboard page, see Client Views - Dashboard Page.
You must create dashboard tiles separately before you can add them to a dashboard page. For information on creating dashboard tiles, see Client Views - Dashboard Tiles.
Dashboard tiles give at-a-glance information in readily digestible chunks. Use dashboard tiles to highlight what you want clients to focus on when they first open the client portal. Once you've created dashboard tiles, you can add, remove, and rearrange them on a client dashboard page.
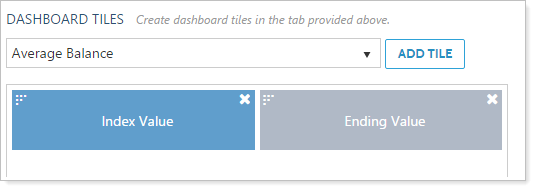
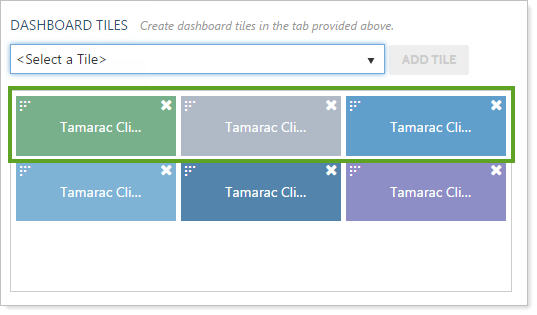
Under Dashboard Tiles, click the tile you want to add, and then click Add Tile.
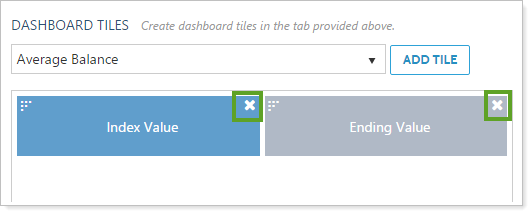
Under Dashboard Tiles, click the  in the upper-right corner. Once you remove it, you can add it back again.
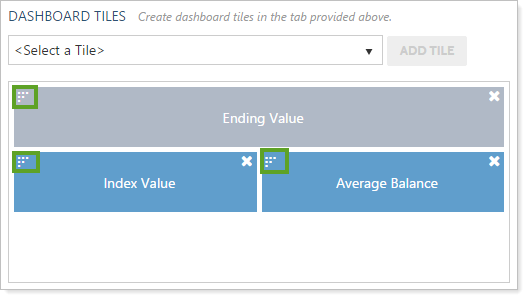
Under Dashboard Tiles, click the  in the upper-left corner and drag the tile to the desired location. You can add up to three tiles per row.
You can change the background color and text color of any tile on your client portal dashboard. Each file can have a unique background and font color. In most cases, we believe it looks best when the tile text color is in a black or white font, as it's easiest for most people to read. However, you can choose any color that you want.
To change the tile text color or the tile background color, follow these steps:
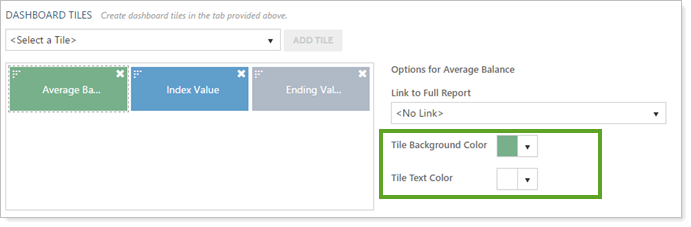
Under Dashboard Tiles, click the tile where you want to change the text color or background color.
In the options that appear on the right, use the Tile Background Color list to change the background color and the Tile Text Color list to change the text color. A preview of the tile will appear on the left.
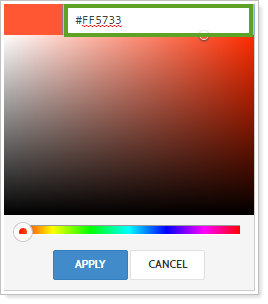
For all colors, you can choose the color using our standard color selection tool or you can type an HTML color code (HEX code), such as #FF5733. To choose a color, click the arrow in the box and either enter the hex code for the color you want or drag the sliders to select a color. When finished, click Apply.
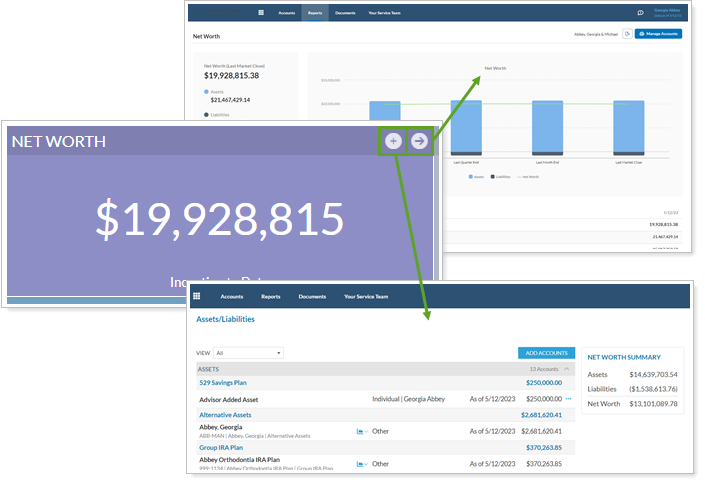
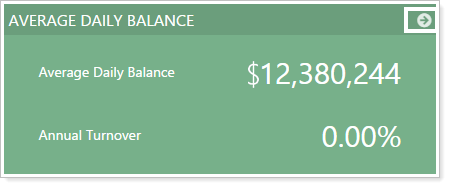
From the Dashboard tiles, you can link to full reports. The links to full reports appear as an arrow icon ![]() on the dashboard tile. When you click this button, you'll go to the full report on the Reports menu and you won't be taken to the report on the Dashboard.
on the dashboard tile. When you click this button, you'll go to the full report on the Reports menu and you won't be taken to the report on the Dashboard.
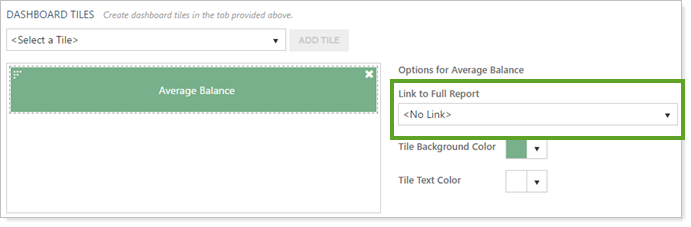
Under Dashboard Tiles, click the dashboard tile where you want to create the link to the full report. In the Link to Full Report list, click the report where you want the link to take the client.
You can allow clients to open the Assets & Liabilities page directly from any dashboard tile that includes a Net Worth data point. For more information, see Link from a Net Worth Dashboard Tile to the Assets and Liabilities Page.