 Back
Back Home > Tamarac Reporting > Clients and Client Portals > Client Portals > Setting Up Client Portals > Client Views > Client Views Pages > Client Views - Dashboard Tiles
|
Back |
Home > Tamarac Reporting > Clients and Client Portals > Client Portals > Setting Up Client Portals > Client Views > Client Views Pages > Client Views - Dashboard Tiles
|
Client Views - Dashboard Tiles
When clients log in to the portal, they first see the dashboard. The client portal dashboard consists of dashboard tiles, dashboard tabs, and reports. This topic discusses dashboard tile options, including how many dashboard tiles you want to display, how they should be displayed, and what kind of data they should show. Each dashboard tile is created separately and then added to a client view.
For more information about the overall client portal dashboard page, see Client Views - Dashboard Page. For information about creating dashboard tiles, see Create, Edit, or Delete a Dashboard Tile.
Tamarac offers a variety of different dashboard tile types, depending on your firm's integrations and setup. The tile type you choose determines the data available to add to the tile.
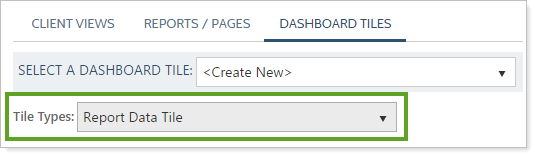
The following tiles are available:
Includes all Summary Report data fields for managed accounts, unmanaged accounts, and account totals, including performance, account value, account activities, and more.
Display Household custom fields, such as most recent meeting date, internal firm financial planning metrics, and more. You only see this tile type if your firm is using Household custom fields.
For more information, see Create and Maintain Households: The Custom Fields Panel.
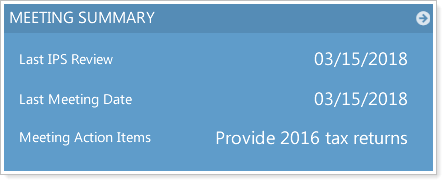
When displaying Household custom fields as dashboard tiles, the field name or the field content may exceed the amount of space available for display. When this happens, the item is truncated with ellipses (…).
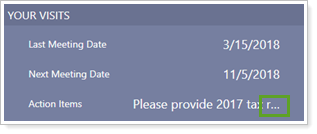
If you have a longer field you want to display, consider creating a dashboard tile with just that single data point. This ensures that the full text is displayed.
If your firm has enabled the MoneyGuide integration, you can also include data point or MoneyGuide chart tiles that show the MoneyGuide Recommended or Current Probability of Success. For more information, see Use MoneyGuide Data in Tamarac.
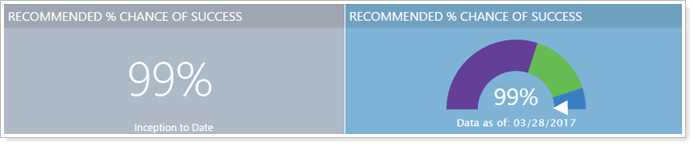
The data sync for the MoneyGuide tile takes a day to complete—until then, the new tile will display N/A. To refresh the data after that, you can import MoneyGuide data on the Households page.
Firms with the MoneyGuide integration can also include a dashboard tile that allows clients to access the financial planning and education resources of MyBlocks using single sign-on. For more information, see Single Sign-On to MoneyGuide MyBlocks From the Tamarac Client Portal.
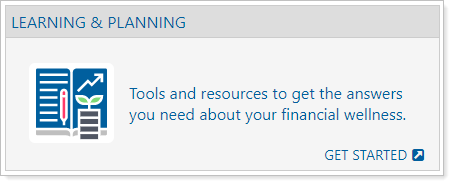
When you add the MyBlocks by MoneyGuide dashboard tile for a client, MyBlocks will become the landing page when that client uses single sign-on from Tamarac to MoneyGuide. Any clients who access the MoneyGuide Play Zone via single sign-on will only have access to MyBlocks via single sign-on after you add a MyBlocks by MoneyGuide dashboard tile.
The individual dashboard tiles consist of three primary customizable elements:
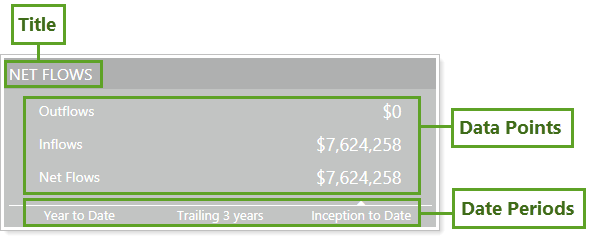
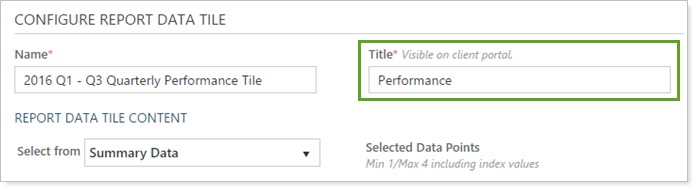
Title.Each dashboard tile has a title that appears in capital letters at the top of the tile. For information about the title, see Title (Client Views).
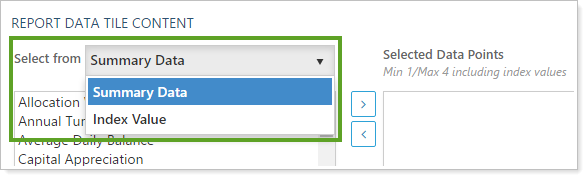
Data Points.There are two primary types of data points in Tamarac Reporting: Summary data or Index values. You can add up to four data points to a tile. For more information about data types, see Select From: Summary Data or Index Value.
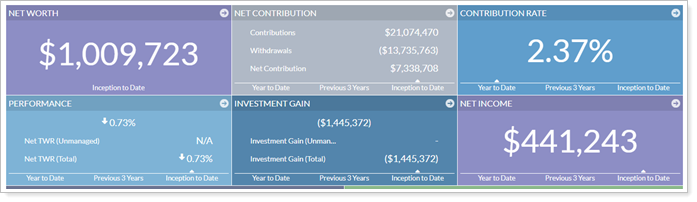
This report displays managed, unmanaged, and total account value, flows, returns and more data points from the Summary report. For details and considerations about these data points, see Summary Report Data Point Calculations.
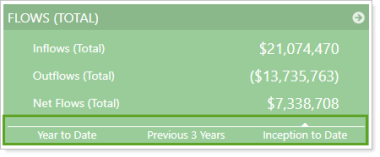
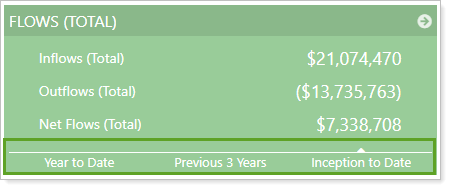
Date Periods.Date periods run horizontally along the bottom of the tile, and you can have up to four date periods on a tile. For more information about date periods, see Use Date or Date Period as Title and Hide Date Period (Single Date Only).
You have two fields for labeling a dashboard tile: Name and Title. Name is an internal-facing label your team uses to identify the tiles. Title is a client-facing label that appears on dashboard tiles in the client portal.
Data points always run vertically. You can add up to four data points on a tile. Tamarac automatically adjusts the font size on the tile based on the number of data points included.
| One Data Point | Four Data Points |
|---|---|
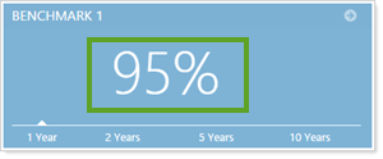
|
|
Choose the type of data you want to add to the tile. For details on the data types, see Select From: Summary Data or Index Value.
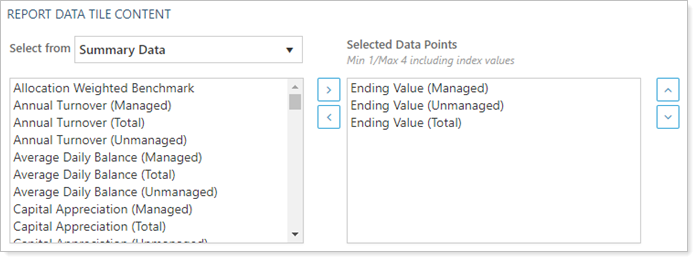
Use Available/Selected to add data points to a tile:
To add a data point, in the left box, click the data point you want to add and then click >.
To remove a data point, in the Selected Data Points box, click the data point you want to remove and then click <.
Use the ˄ and ˅ buttons to arrange the data point on the tile.
You can rename any data point. For example, you can rename the Gross IRR data point to simply display Gross Return on the portal.
To rename data points:
In the Selected Data Points list, click the data point you want to rename.
Clear Use Default.
In Data Point Name, type the new display name. If you don't want the name to appear at all—for example, in the case of a simple performance tile—you can leave the name blank.
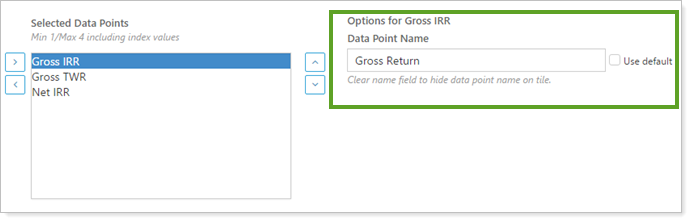
Click Save.
Date periods run horizontally, and you can have up to four date periods on a tile. You can use any date period you have in Tamarac Reporting.
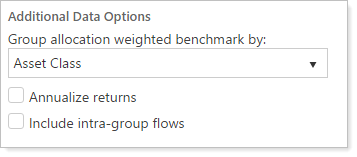
You also have the option to configure the following settings:
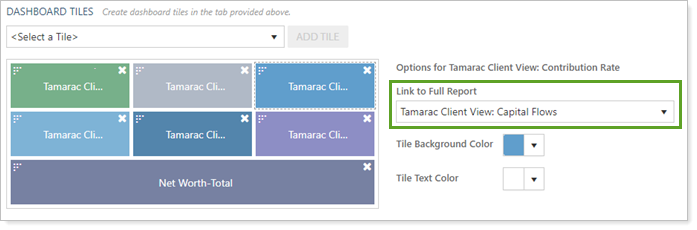
Dashboard tiles can dynamically link to reports or pages you've added to the client portal. Link a dashboard tile to a related report, or use it to allow clients to quickly access their assets and liabilities. For example, on a dashboard tile that shows contribution rate, link directly to the Capital Flows report.
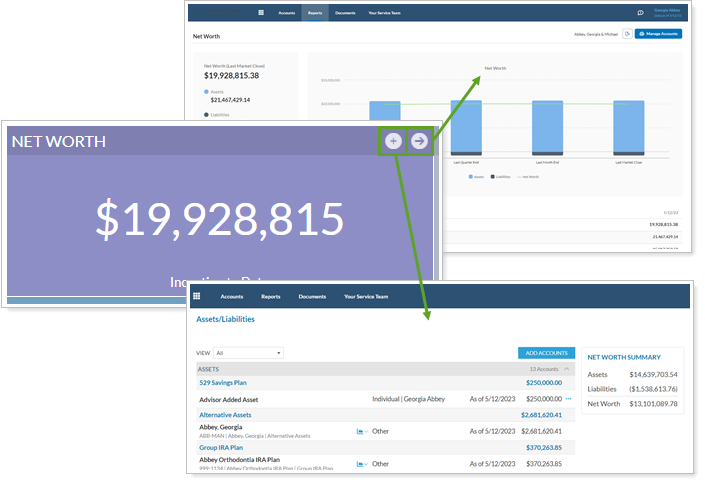
You can allow clients to open the Assets & Liabilities page directly from any dashboard tile that includes a Net Worth data point. For more information, see Link from a Net Worth Dashboard Tile to the Assets and Liabilities Page.
For steps on how to create, edit, or delete a dashboard tile, see Create, Edit, or Delete a Dashboard Tile.
For more information on changing the background colors and layout of background tiles for your dashboard, visit Client Views - Dashboard Page.