Back
Back Home > Tamarac Reporting > Integrations > Financial Planning > MoneyGuide Integration > Use MoneyGuide Data in Tamarac
|
Back |
Home > Tamarac Reporting > Integrations > Financial Planning > MoneyGuide Integration > Use MoneyGuide Data in Tamarac
|
Use MoneyGuide Data in Tamarac
This page provides details on how to see and use MoneyGuide data including probability of success and plan summary results in Tamarac.
Additional MoneyGuide integration features include:
Export/Import Data. Export and import data between Tamarac Households and MoneyGuide plans. For more information, see Export and Import MoneyGuide Data.
Single Sign-on to MoneyGuide Plans. Log in to a MoneyGuide plan from Tamarac. For more information, see Open MoneyGuide Plans From Tamarac.
For more information on the MoneyGuide integration, see Introduction to the MoneyGuide Integration.
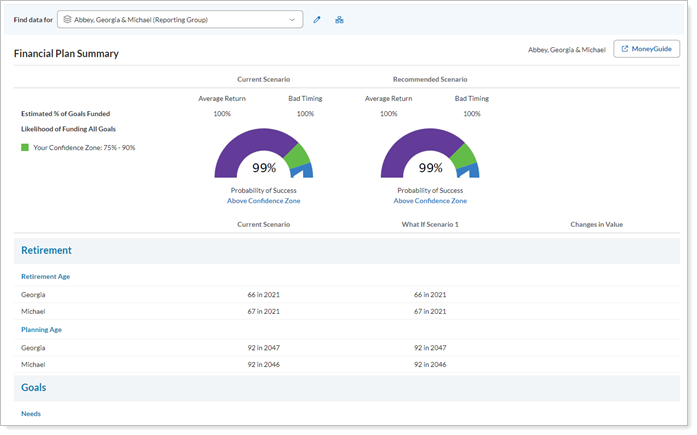
The Financial Plan Summary report shows impact of different decisions on the probability of success by allowing you to compare the current scenario and your recommended scenario side by side, with the difference between them marked in the Changes in Value column.
This section provides details of how to run the report or add it to a client portal. For more information about the report's features, see Financial Plan Summary Report.
The initial data sync takes a day to complete—until then, the MoneyGuide data in Tamarac, including any dashboard tiles, will display N/A.
MoneyGuide automatically updates data when you look at a MoneyGuide report or dashboard tile if 18 hours or more have passed since the Household's last data refresh. The refresh can either occur automatically or via a manual import. For more information, see Export and Import MoneyGuide Data.
Use the dynamic report to facilitate discussions that include financial planning, investments, and performance.
To access the dynamic Financial Plan Summary report in Tamarac:
On the Reports menu, under Financial Planning Reports, click Financial Plan Summary.
In the Find Data For list, select for the account or Household you want to review.
The report automatically loads.
Use the report on a client portal to show clients how your firm helps them achieve financial goals. For a seamless transition, link directly to this report from a MoneyGuide success meter dashboard tile.
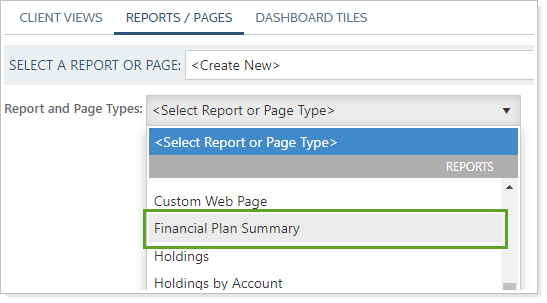
To add the Financial Plan Summary to a client portal as a report, see Client Views - Reports Pages. To add it as report on the dashboard, see Client Views - Dashboard Page.
There are two types of MoneyGuide dashboard tiles you can add to your client portal: tiles that show MoneyGuide data or a tile that allows clients to access MoneyGuide MyBlocks using single sign-on.
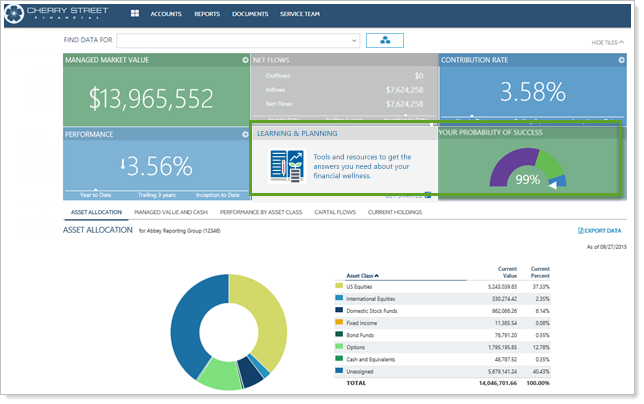
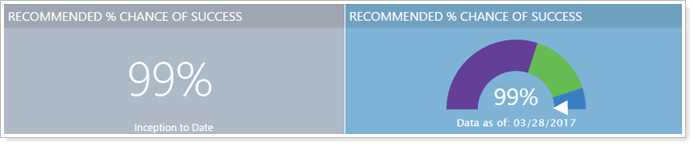
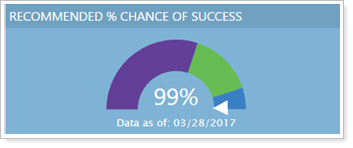
You can choose to display MoneyGuide Current Probability of Success or MoneyGuide Recommended Probability of Success as either a data point or a MoneyGuide-style chart, with the date shown on the tile reflecting the most recent date Tamarac received updated MoneyGuide data.
To help proactively answer client questions, link from a percent chance of success tile directly to the Financial Plan Summary report from a dashboard tile. For more information on linking to reports from dashboard tiles, see Client Views - Dashboard Page.
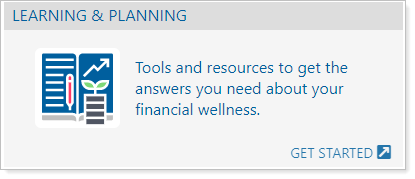
To allow clients to access the financial education and planning resources of MoneyGuide MyBlocks using single sign-on, you can add a MyBlocks by MoneyGuide SSO dashboard tile.
Use the MyBlocks by MoneyGuide SSO dashboard tile to allow clients who already use MyBlocks to access it easily and to encourage more clients to begin using the MyBlocks tools.
When you add the MyBlocks by MoneyGuide dashboard tile for a client, MyBlocks will become the landing page when that client uses single sign-on from Tamarac to MoneyGuide. Any clients who access the MoneyGuide Play Zone via single sign-on will only have access to MyBlocks via single sign-on after you add a MyBlocks by MoneyGuide dashboard tile.
For more information about creating and configuring a MyBlocks by MoneyGuide SSO dashboard tile, see Single Sign-On to MoneyGuide MyBlocks from Tamarac Reporting.
To create a dashboard tile with a MoneyGuide success meter:
On the Client Reporting menu, under Client Portal Settings, click Client Views.
Click Dashboard Tiles.
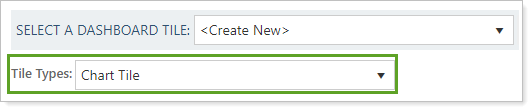
In Select a Dashboard Tile, choose <Create New>.
Under Tile Types, choose Chart Tile.
In Chart Tile Content, select the desired chart.
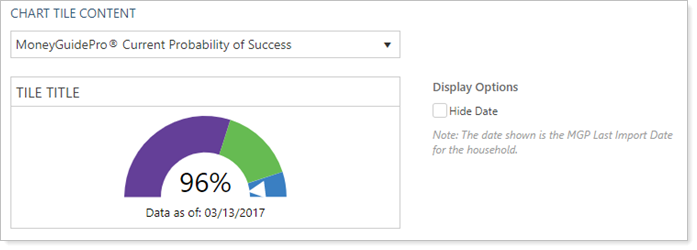
Configure Hide Date.
Click Save.
For more information on adding the tile to your client views, visit Create a Client View.
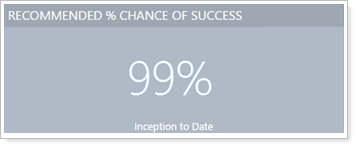
To create a dashboard tile that displays the percent change of success data point:
On the Client Reporting menu, under Client Portal Settings, click Client Views.
Click Dashboard Tiles.
In Select a Dashboard Tile, choose <Create New>.
Under Tile Types, choose Report Data Tile.
In Report Data Tile Content, set Select from to Summary Data.
From the list of data points, choose the desired data point.
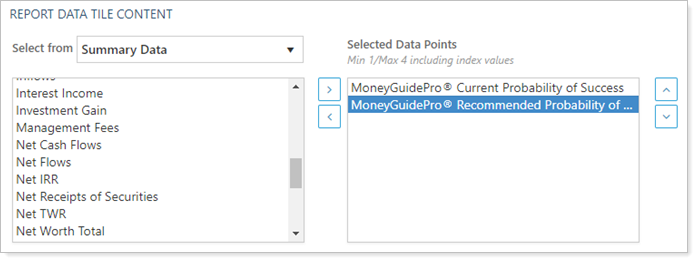
Click the data point and then click  to add it to the Selected Data Points list.
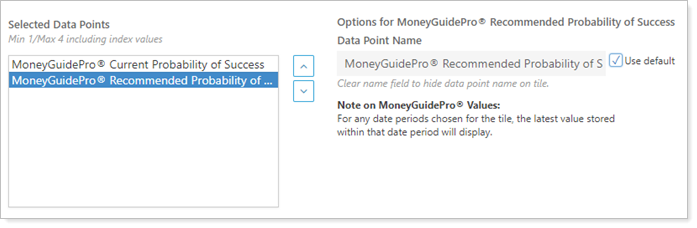
Optional: To edit the display name, click the data point and edit Data Point Name.
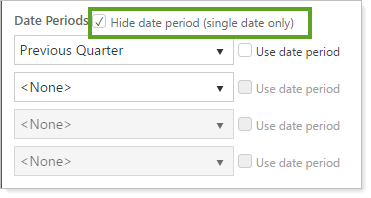
Set the desired date periods and configure the date period settings as desired: Hide date period (single date only) and Use date period.
Click Save.
For more information on adding the tile to your client views, visit Create a Client View.
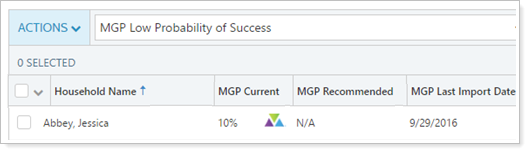
In order to help you keep track of the integration status and percent chance of success, when MoneyGuide integration is enabled, you will be able to add MoneyGuide-specific columns on the Household page view. For more information about creating and editing Household views, see Households Page Actions, Views, and Filters.
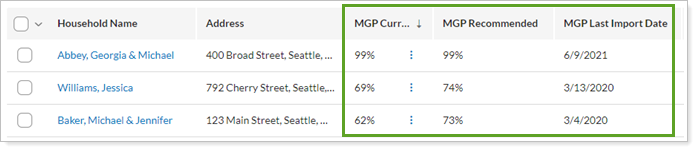
The columns are:
| Column Name | Column Data |
|---|---|
| MGP Current | The current probability of success for the MoneyGuide plan. This is also where you manage data export and import. For more information, see Export and Import MoneyGuide Data. |
| MGP Recommended | The recommended probability of success for the MoneyGuide plan. |
| MGP Last Import | The last date Tamarac Reporting imported MoneyGuide data. |
Click the column headers to sort by ascending or descending value so you can review Households that have not been synced recently, or which clients have the highest or lowest probability of success.
Use saved searches to monitor probability of success and last import date on the Household page. For more information about creating and using saved searches, see Learn More About Saved Searches.
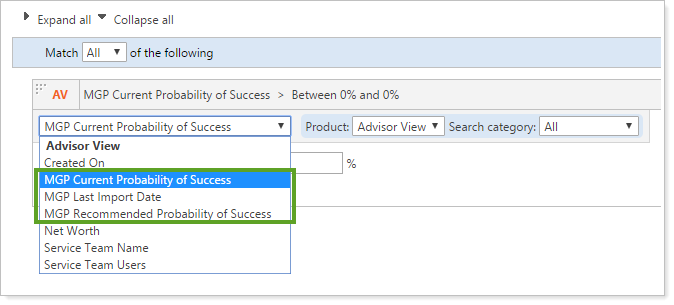
The following MoneyGuide-specific filters are available in Household saved searches:
MGP Current Probability of Success
MGP Recommended Probability of Success
MGP Last Import Date
To find Households with a probability of success less than 50% that have not been synced recently, you can create the following saved search:
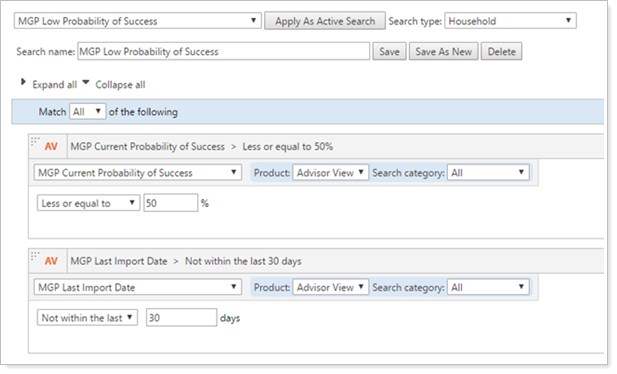
The saved search, when applied to the Households page, filters out all but accounts that meet the search criteria: