
Contents
Introduction
| Applies to: | |||
|---|---|---|---|
| ✔ Dynamic | Mobile | ✔ Client Portal | |
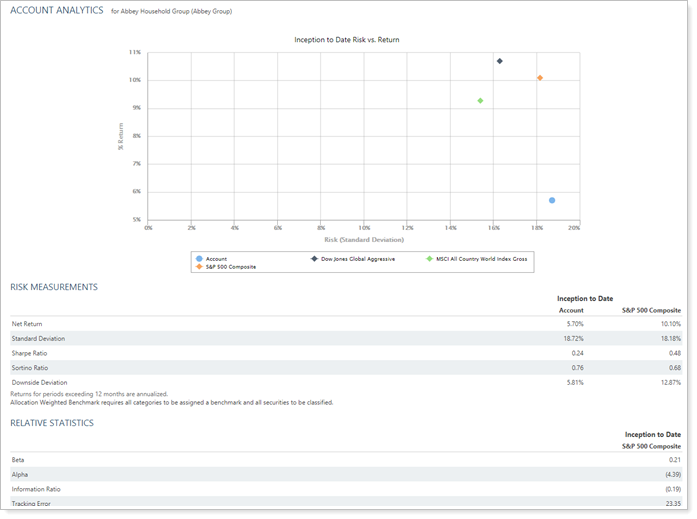
The Account Analytics report provides a clear comparison of a variety of risk-adjusted returns that you select for an account or group with designated benchmarks and indexes.
Three report sections allow you to access the precise data you need when evaluating risk and returns:
-
The Risk vs. Return chart:Shows risk and returns on the x- and y-axes for one date period. Add benchmarks, indexes, and allocation-weighted benchmarks for a visual comparison of where the account falls.
-
The Risk Measurements table:You can add risk measurements as rows and date periods, accounts, benchmarks, and indexes as columns to create a table that shows how an account's risk measurements and returns compare with those of benchmarks or indexes.
The following risk measurements are available (click a link for a definition):
-
The Relative Statistics table:You can add relative statistics as rows and date periods, accounts, benchmarks, and indexes as columns to create a table that shows how an account's relative statistics compare with those of benchmarks or indexes.
The following relative statistics are available (click a link for a definition):
For information about how to see benchmarks on the risk measurements or relative statistics table, see Add Benchmarks to Risk Measurements and Relative Statistics.
Performance Calculation Notes
-
All returns are annualized time-weighted returns (TWR).
-
The Account Analytics report always displays return information for the last contiguous account period, even if you are using the enhanced performance calculations and are including returns across gaps.
-
In PDF reports, lines that do not include data will be dropped from tables if you're using the enhanced performance calculations.
Note
This report only includes managed assets.
Why Use the Account Analytics Report?
In the Account Analytics report, you will find versatile sorting and charting options that let you answer many questions about risk and return for accounts and groups, such as:
-
Over these date periods, How has this account performed compared with the risk taken? Evaluate the holdings in accounts or groups by category type, such as asset class or security type.
-
Over one Date Period, How has this Account Performed Compared With Benchmarks?Compare current allocation with assigned target allocation, with side-by-side charts and data points.
-
Have we stayed consistent with our investment mandate?Identify when an investment may be drifting from the intended strategy or confirm the account remains on target.
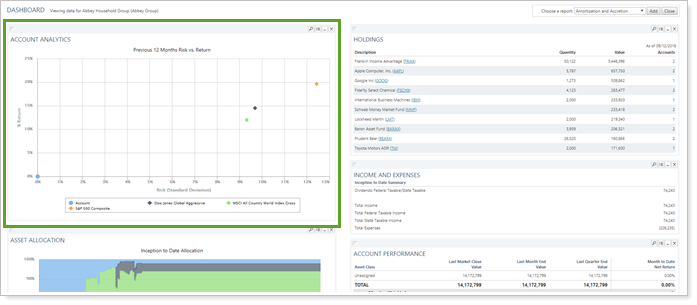
See the Account Analytics Report in Action
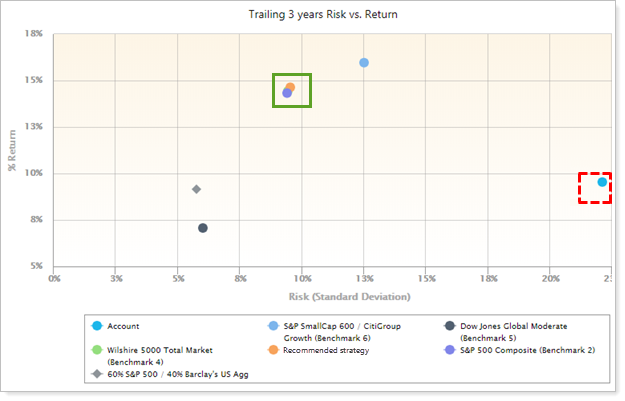
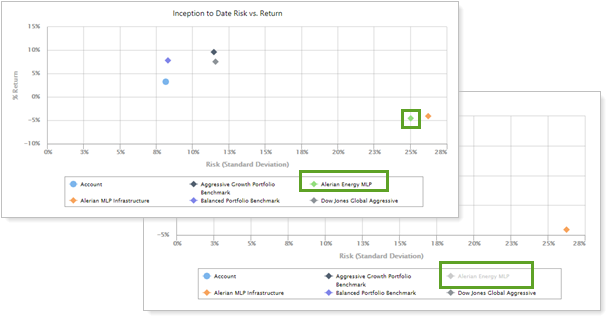
An advisor wants to compare the risk/return breakdown for a prospect's current investment strategy as compared with the advisor's recommended strategy. The advisor creates a demonstration account with the same investments as the prospect.
When meeting with the prospect, the advisor uses the Account Analytics Risk vs. Return chart to compare the demo account (in red dotted box) with the recommended strategy (in green solid box, along with a couple of very close indexes). The advisor points out that the client's current strategy assumes substantial risk without corresponding returns, while the recommended strategy offers less risk with higher returns.
This provides an opening for the advisor and prospect to discuss the firm's services and how the prospect could benefit from working with the advisor.
Features of the Account Analytics Report
The dynamic report helps you easily filter and sort data to drill down to meaningful results. Interactive reporting features include the following.
Choose Which Report Sections to See
Depending on your needs, include or exclude a chart showing the risk vs. return and tables of risk measurements or relative statistics.
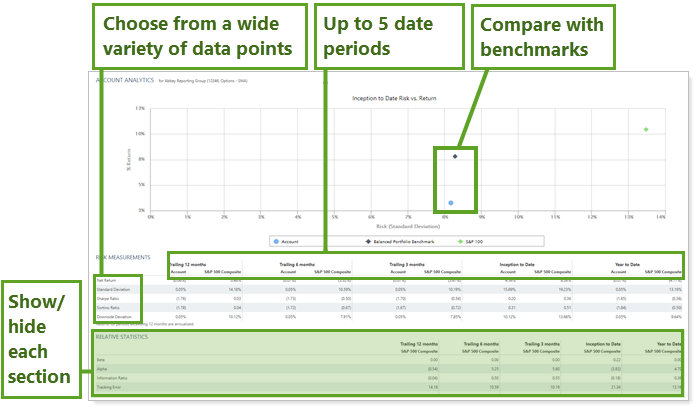
Include Up to Five Date Periods
For the Risk Measurements and Relative Statistics sections, choose between one and five data periods from among all the data periods available to you within your enterprise.
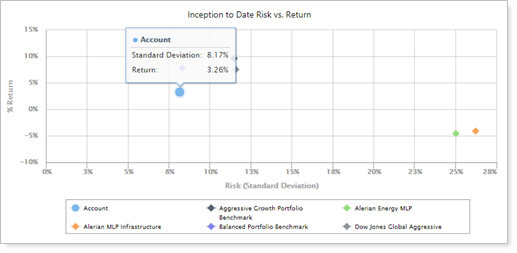
Use Tooltips to See Details
Hover over a category to see a tooltip with details for that data point.
Customize Data on the Fly
Click data points in the chart legend to show/hide data points.
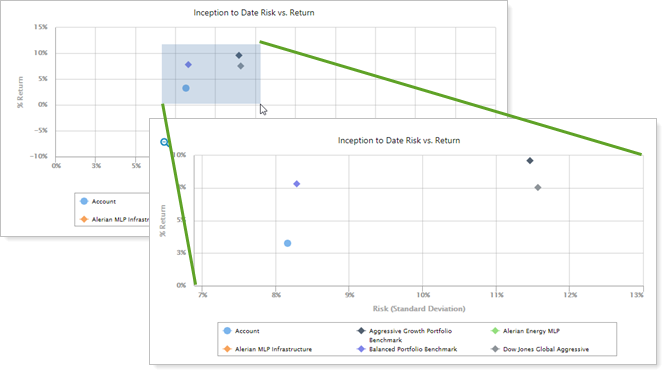
Zoom In or Out to Change the View
Zoom in on the chart by clicking and dragging to select an area. You can then scroll through the zoomed area by holding down the Shift key and dragging to the left or right. Reset your zoomed chart quickly by clicking the  button.
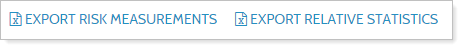
Export Report Data to Excel
If you want to dive deeper into your own calculations based on risk measurements and relative statistics, you can export the data from either table as a CSV.
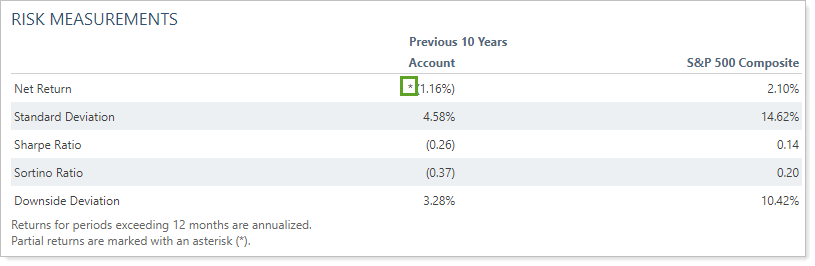
Identify Partial Period Returns
The following symbols mark partial period returns on the Account Analytics Risk Measurements table:
- Dagger (†): Linked partial period (TWR only).
- Asterisk (*): All other partial period returns (TWR and IRR).
On the Account Analytics PDF report, partial period returns and linked returns are also represented with designations and footnotes that match the dynamic report.
Add Account Analytics to the Reporting Dashboard
You can use dashboard views to see a pared-down, at-a-glance summary of the main dynamic report on your dashboard.
To learn more about creating and managing dashboard views in general, see Create and Share Dashboard Views.
For more information on customizing your dashboard, visit Working With Dashboard Modules.
Account Analytics Report Settings
The following settings are available for the Account Analytics report. Click the setting name for more details.
| Setting | Details | Available In... | |||
|---|---|---|---|---|---|
| Dynamic Report | PDF Report | Reporting Dashboard | PDF Dashboard |
||
| Report Name | Designate a unique name for the report view. | X | X | ||
| Mark as Publicly Accessible | Share the report view. | X | |||
| Section Title | Designate what the section will be called in the PDF report. | X | X | ||
| Theme | Designate what theme the section will use. | X | |||
| Header and Footer | Choose a unique header and footer for the section or use defaults. | X | |||
| Include Page Break After This Section |
Control where page breaks occur in PDF reports. |
X | |||
| Account Grouping | Control grouping of accounts and groups. | X | |||
| Include Reports for Closed Accounts | Choose to show sections for accounts that were closed before the report as-of date. | X | |||
| Show Returns As Net or Gross |
Determine how returns should appear on the report. |
X | X | X | X |
| Annualize Returns | Report the returns as annualized returns. | X | X | X | X |
| Assign Risk Free Rate (Static or Index) | Assign the risk free rate you want the report to use. | X | X | X | X |
| Group Allocation Weighted Benchmark By | Designate which category of allocation weighted benchmark is used in the return calculations. | X | X | X | X |
| Minimum Acceptable Return | Enter the minimum acceptable return that you want to use for the for the Downside Deviation and Sortino Ratio calculations. | X | X | X | X |
| Calculate Analytic Values Using Daily or Monthly Returns |
Designate whether to calculate performance values based on daily or monthly returns. |
X | X | X | X |
| Number of Required Observations | Indicate minimum acceptable number of data points when calculating analytic values. | X | X | X | X |
|
This setting is called Risk vs. Return Scatter Plot in the PDF Dashboard. |
Show or hide the risk vs. return chart. |
X | X | X | |
| Use Account Name in Chart Legend | Choose how the account is referred to on the risk vs. return scatterplot. | X | X | ||
| Show Values For | Set a date period to use for performance calculations in the report. | X | X | ||
| Use Date or Date Period as Title | Use the date (MM/DD/YYYY) as the title of the column heading, rather than the name of the date period. | X | X | ||
| Use Account Name in Chart Legend | Choose how the account is labeled in the chart. | X | X | ||
| Select the date period you want to use for the report. | X | X | |||
| Use Inception Date | Report partial periods in PDF reports for instances where the account or group was opened after the beginning of the date period selected. | X | X | ||
| Include Allocation Weighted Benchmark | Add the allocation weighted benchmark as a data point for comparison with the account. | X | X | X | X |
| Include Benchmarks | Add the performance of one or more of the firm's custom benchmarks as a data point for comparison with the account. | X | X | X | X |
| Include Additional Indexes | Add the performance any of the firm's available indexes, custom indexes, or blended indexes as a data point. | X | X | X | |
| Show Risk Measurements |
Show or hide the risk measurements table. |
X | X | X | |
| Show Relative Statistics |
Show or hide the relative statistics table. |
X | X | X | |
| Set what Account Analytics section you want displayed as a dashboard report. | X | ||||
|
Choose which indexes are included and in what order. |
X | X | |||
Report Actions
To learn more about reports in Tamarac, see Introduction to Reports.
To learn more about how to generate a report, change the data displayed, print or export the report data, and more, see Basics of Working With Reports.
To learn more about creating and using PDF reports, see Understanding PDF Reports and Workflow: Generate a PDF Report.