
Contents
How Show Risk vs. Return Chart Works
| Applies to: | ||
|---|---|---|
| ✔ Dynamic | ✔ Client Portal | |
This setting allows you to choose whether or not to display the risk vs. return chart above the data statistics table in the Account Analytics report.
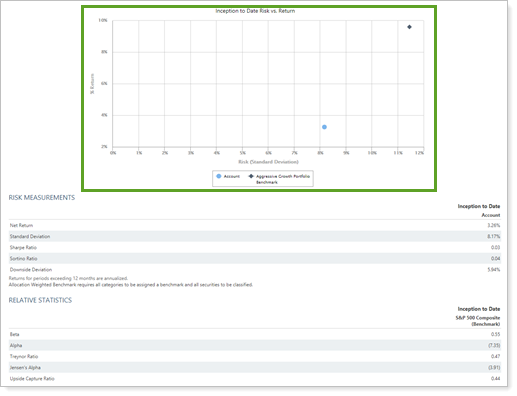
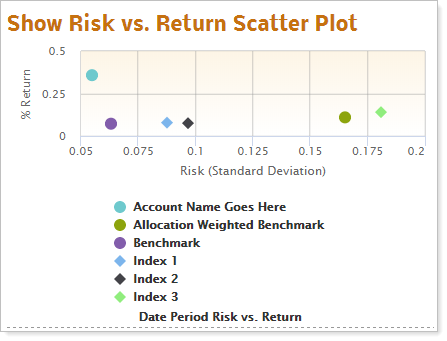
This chart illustrates in a clear, visual way how much risk an account or group took and the corresponding returns. It effectively compares risk and reward of the account or group, the market (as represented by an appropriate index), other indices, benchmarks, and allocation weighted benchmarks.
Risk is measured as standard deviation in this chart.
In Dynamic Reports
-
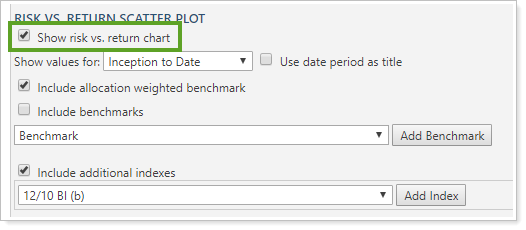
To show the Risk vs. Return scatter plot chart, select Show risk vs. return chart. The Risk vs. Return scatter plot chart section is displayed above the Risk Measurements and Relative Statistics table sections.
-
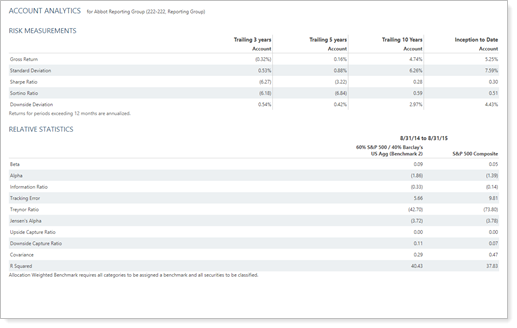
To hide the Risk vs. Return scatter plot chart, clear Show risk vs. return chart. The Risk vs. Return scatter plot chart section is hidden. Only the Risk Measurements and Relative Statistics table sections are displayed.
When you select the Show risk vs. return chart check box, the following additional settings appear:
In PDF Reports
Full PDF Report Section
Functionality is the same in the full PDF report template as in dynamic reports.
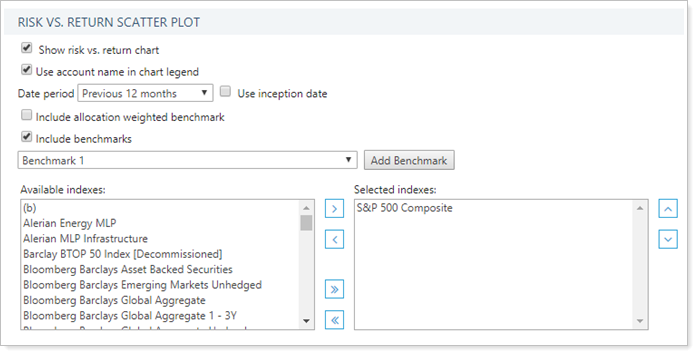
When you select the Show risk vs. return chart check box on the Account Analytics report, the following settings appear:
PDF Dashboard Report Section
When you add the Account Analytics report to one of the PDF Dashboard report panels, you can choose to add one of the three Account Analytics sections to the panel. The options are:
-
Risk vs Return Scatter Plot
-
Risk Measurements
-
Relative Statistics
For more information on risk measurements or relative statistics, see Show Risk Measurements and Show Relative Statistics
-
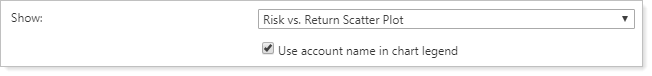
To add the risk vs. return scatter plot to the PDF Dashboard report panel, click Risk vs Return Scatter Plot in the Show list. When you show the risk vs. return chart, you can choose how to display the account with the Use account name in chart legend check box.
Reports With This Setting
Performance Reports PDF-Specific ReportsRelated Settings
For more information about date periods, see Dates and Date Periods. For more information about themes, see Site Themes and Understanding PDF Themes.
The following are related settings: