
Contents
How Show Relative Statistics Works
| Applies to: | ||
|---|---|---|
| ✔ Dynamic | ✔ Client Portal | |
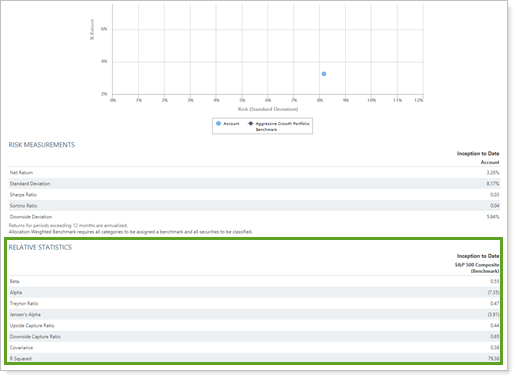
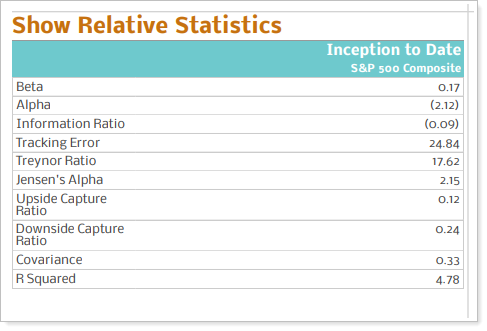
This setting allows you to choose whether or not to display the relative statistics table on the Account Analytics report. The relative statistics table summarizes the following relative comparison statistics:
You would use the relative statistics table if you want to provide your clients with the data points that go into calculating risk measurements. Useful statistics might vary depending on your strategy. For example, if you're a passive advisor, maybe you want to show beta, whereas if you're an active investor, maybe you want to compare with alpha. This table is good for a financially savvy clients who want to know details, or for internal firm evaluations.
In Dynamic Reports
-
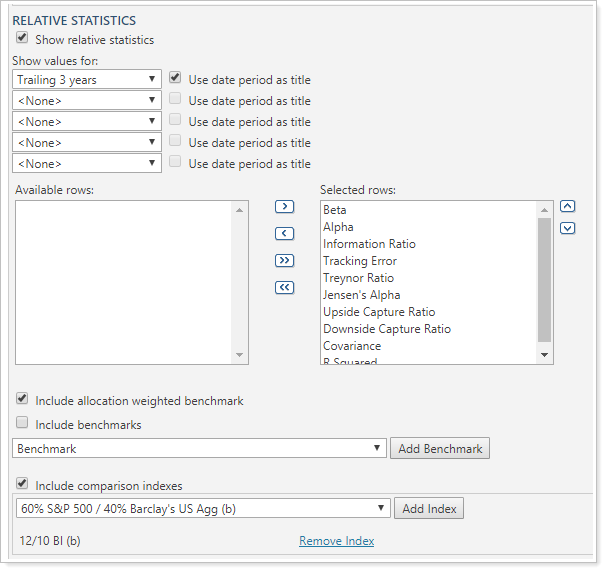
To show the relative statistics table, select Show relative statistics. The Relative Statistics section is displayed below the Risk Measurements table.
When you select the Show relative statistics check box, the following related settings appear:
-
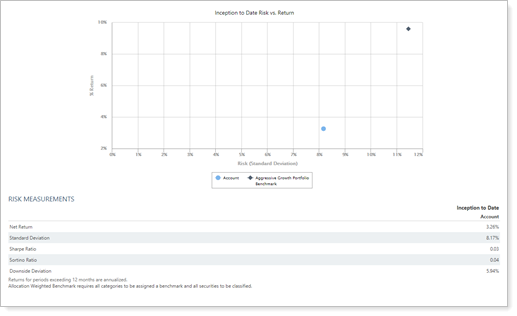
To hide the relative statistics table, clear Show relative statistics. The Relative Statistics section is hidden. Only the Risk vs. Return chart and the Risk Measurements table are shown.
In PDF Reports
Full PDF Report Section
Functionality is the same in the full PDF report templates as in dynamic reports.
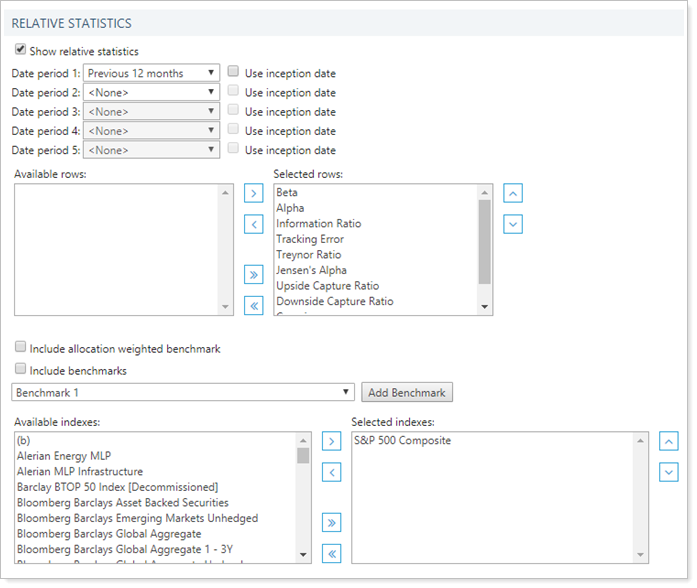
When you select the Show relative statistics check box in the PDF report, the following additional settings appear:
- Date periods
- Available/selected indexes
- Include allocation weighted benchmark
- Include benchmarks
- Include additional indexes
PDF Dashboard Report Section
When you add the Account Analytics report to one of the PDF Dashboard report panels, you can choose to add one of the three Account Analytics sections to the panel. The options are:
-
Risk vs Return Scatter Plot
-
Risk Measurements
-
Relative Statistics
For more information on the risk vs. reward chart or risk measurements, see Show Risk vs. Return Chart and Show Risk Measurements.
-
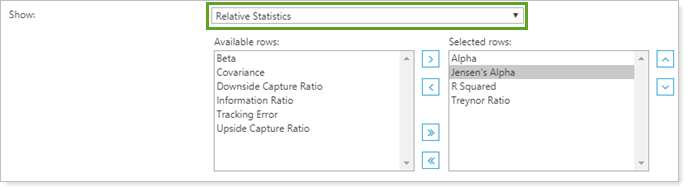
To add the relative statistics table to the PDF Dashboard report panel, click Relative Statistics in the Show list.
Reports With This Setting
Performance Reports PDF-Specific ReportsRelated Settings
For more information about date periods, see Dates and Date Periods. For more information about themes, see Site Themes and Understanding PDF Themes.