
Beta is a measure of a portfolio's sensitivity to market movements. The beta of the market is 1.00 by definition. A beta of 1.10 shows that the portfolio has performed 10% better than its benchmark in up markets and 10% worse in down markets, assuming all other factors remain constant. Conversely, a beta of 0.85 indicates that the portfolio's excess return will perform 15% worse than the benchmark's excess return during up markets and 15% better during down markets.
Beta can be a useful tool when at least some of a portfolio's performance history can be explained by the market as a whole. It is important to note that a low beta does not necessarily imply a low level of volatility. A low beta signifies only that benchmark-related (market-related) risk is low.
A specialty fund that invests primarily in gold, for example, will usually have a low beta, as its performance is tied more closely to the price of gold and gold-mining stocks than to the overall stock market. Thus, the specialty fund might fluctuate wildly because of rapid changes in gold prices, but its beta will remain low. R-squared is a necessary statistic to factor into the equation, because it reflects the percentage of a portfolio's movements that are explained by movements in its benchmark.
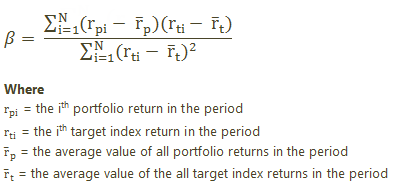
The Calculation
When Beta Uses Gross or Net Returns
On the Account Analytics report, you can control whether this calculation uses net or gross with Show Returns As (Net or Gross).
When you run composites, the Composite Statistics report reports only on gross returns. For more information, see Composite Statistics.