
Contents
|
Create a Composite Statistics View Delete a Composite Statistics View |
Introduction
In addition to performance returns, composite reporting in Tamarac Reporting includes the following analytics and dispersion and risk comparison metrics:
|
|
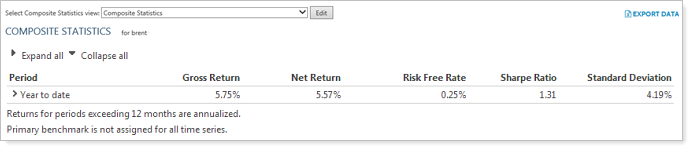
View Composite Statistics
To view composite statistics, follow these steps:
-
On the Reports menu, under Composite Reports, click Composite Statistics.
-
In the Find Data For list, enter the name or account number for the desired composite and click Change. The report appears on your screen.
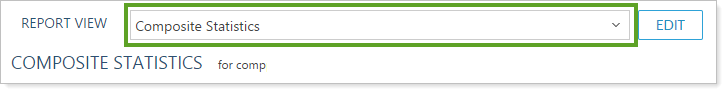
-
In the Report View list, choose a composite statistics view for the composite.
For more information on creating composite statistics views, see Composite Statistics Views.
Composite Statistics Views
Composite statistic views are pre-defined layout snapshots. The report views make it easy to create several customized statistical views that show slightly different information—for example, some users may find it convenient to show deviation information vs. the specified benchmark.
Create a Composite Statistics View
To create a composite statistics view, follow these steps:
-
On the Reports menu, under Composite, select Composite Statistics.
-
In the Report View list, select<Create New>.
-
Complete any of the following:
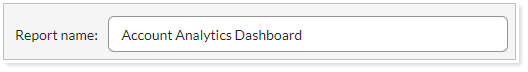
Setting More Information Report name The name you type in this box will appear in the Report View list. All users who have viewing permissions see it.

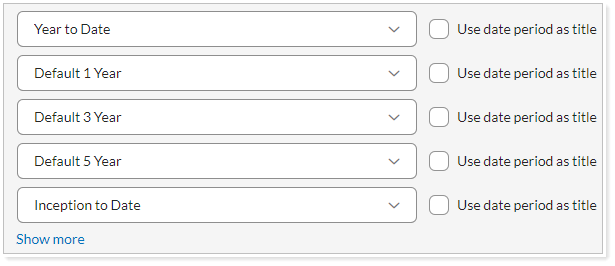
Date Periods Select the date periods you want to see on the report.
Mark as publicly accessible Select this check box to allow others to see this report (if they have the appropriate permissions set by your administrator on the User Management page).
Annualize returns When you select this check box, Tamarac Reporting will convert the returns to a rate that reflects the rate on a yearly basis.
Calculate analytic totals using Choose whether, at the account level for the calculated analytics, you want to use:
-
Daily returns
-
Time series returns
You may want to use the time series option if you want to aggregate data (for example, to see the three year standard deviation) when viewing metrics for composites where the history has been uploaded.
Available / Selected columns Choose the statistics you want to appear on the composite statistics view.
You can add Beta, Excess Return, Gross Return, Information Ratio, Jensen's Alpha, Risk Free Rate, Tracking Error, Standard Deviation, Primary Benchmark Standard Deviation, Secondary Benchmark Standard Deviation, Net Return, Sharpe Ratio, Primary Benchmark Return, Secondary Benchmark Return, and Treynor Ratio.
-
-
When finished, click Create. You can repeat these steps for each composite statistics view you want to create.
Delete a Composite Statistics View
To delete a composite statistics view, follow these steps:
-
On the Reports menu, under Composite Reports, click Composite Statistics.
-
In the Report View list, choose the view you want to delete.
-
Click Delete. In the alert window, click Delete.
Edit a Composite Statistics View
To edit a composite statistics view, follow these steps:
-
On the Reports menu, under Composite Reports, click Composite Statistics.
-
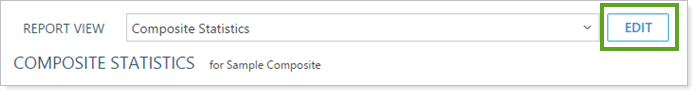
In the Report View list, choose the view you want to edit.
-
Click Edit.
Ratios & Comparison Indexes
| Ratio | Comparison Index |
|---|---|
| Beta | Primary benchmark |
| Information ratio | Primary benchmark |
| Jensen's Alpha | Risk free rate, primary benchmark |
| Tracking error | Primary benchmark |
| Treynor ratio | Risk free rate, beta (primary benchmark inferred) |
| Excess return | Primary benchmark |
| Sharpe ratio | Risk free rate |
| Covariance | Primary benchmark |
| Primary benchmark | |
| R-squared | Primary benchmark |