
Contents
How Show Section Works
| Applies to: | ||
|---|---|---|
| ✔ Dynamic |
Client Portal |
|
This setting allows you to set what Account Analytics section you want displayed as a dashboard report. You can choose to display one at a time, but it can be useful to create multiple dashboard reports, each focused at addressing specific needs.
In Dynamic Reports
You can choose to create a dashboard Account Analytics report that displays any one of the following sections:
-
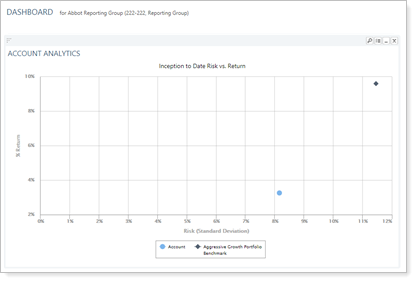
Risk vs. Return Scatter Plot. The dashboard report shows the Risk vs. Reward Scatter Plot as configured in the Account Analytics report and based on the date period you set in the dashboard settings.
-
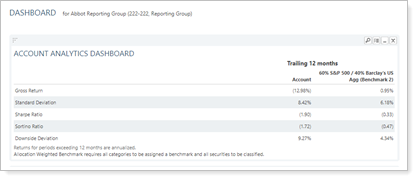
Risk Measurements. The dashboard report shows the risk measurements table as configured in the Account Analytics report and based on the date period you set in the dashboard settings.
-
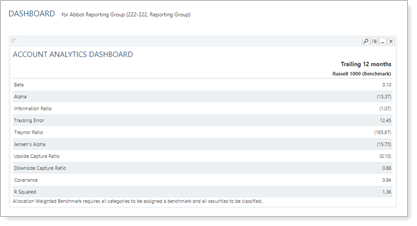
Relative Statistics. The dashboard report shows the relative statistics table as configured in the Account Analytics report and based on the date period you set in the dashboard settings.
In PDF Reports
This setting is not available for PDF reports.
Reports With This Setting
Performance ReportsRelated Settings
For more information for creating date periods, see Dates and Date Periods.
The following settings are related to this option: