
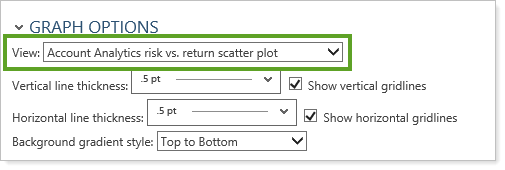
This setting allows you to choose what chart or graph you're editing. The settings available change depending on what you select from the list.
The following graphs are available for editing:
-
Account Analytics risk vs. return scatter plot
-
Account Performance line graph
-
Account Performance bar chart
-
Asset Allocation bar chart
-
Bond Analysis bar chart
-
Capital Flows account value vs net investment chart
-
Capital Flows summary bar chart
-
Net Worth bar chart
-
Projected Income bar chart
-
Summary bar chart
Depending on which graph you select, any of the following settings may be available:
Learn More
For more information on site themes and customizing chart colors, see Site Themes.
For more information about customizing the menu bar, see Customizing the Menu Bar.