
Contents
How Show Account Values vs. Net Investment Chart Works
| Applies to: | ||
|---|---|---|
| ✔ Dynamic |
✔ Client Portal |
|
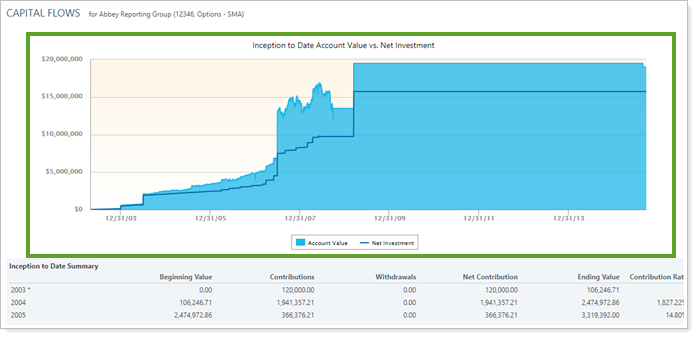
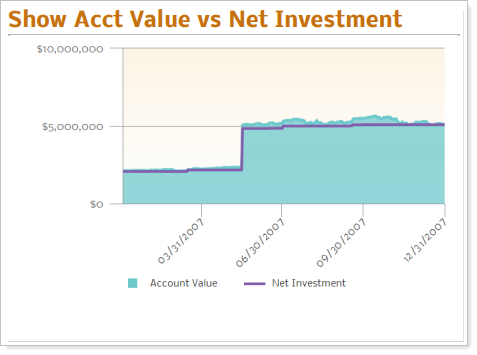
This setting allows you to display or hide the Account Value vs. Net Investment chart on the Capital Flows report. The chart shows net contributions compared with the account value, which allows you to clearly see the investment gain.
This chart is especially good for troubleshooting performance returns, especially around investment gains. Because the chart clearly shows investment gain—it's the difference between the net contribution line and the value line—you can readily troubleshoot where there might be mismatches.
In Dynamic Reports
When you select this option, the title of the chart is automatically generated as [Date period] + Account Value vs. Net Investment. For example, if Date period set to Inception to Date, the title automatically generated is Inception to Date Account Value vs. Net Investment.
-
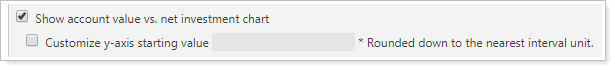
To show the line chart, select Show account value vs. net investment chart.
-
To hide the line chart, clear Show account value vs. net investment chart.
When you select Show account value vs. net investment chart on the Capital Flows report, the following settings appear:
In PDF Reports
Full PDF Report Section
Functionality is the same in the full PDF report template as in dynamic reports.
PDF Dashboard Section
When you add the Capital Flows report to one of the PDF Dashboard panels, you can choose to add one of the three Capital Flows sections to the panel. The options are:
-
Account Value vs. Net Investment Chart
-
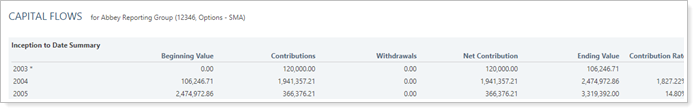
Summary
-
Summary Chart
For more information on the summary table or summary chart, see Show Summary and Show Summary Chart Based On.
-
To add the account value vs. net investment chart to the PDF Dashboard panel, click Account Value vs. Net Investment in the Show list.
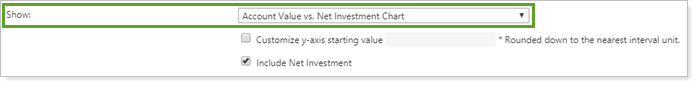
When you add the account value vs. net investment chart, the following additional settings are available: