
Contents
How Show Summary Chart Based On Works
| Applies to: | ||
|---|---|---|
| ✔ Dynamic |
✔ Client Portal |
|
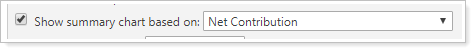
This setting allows you to show or hide a bar chart that summarizes capital flows, and to set whether the bar chart displays data based on net contribution or contribution rate.
You would choose based on what's clearest for your clients. Sometimes contribution rate can be confusing, especially if the report looks at inception contributions.
In Dynamic Reports
-
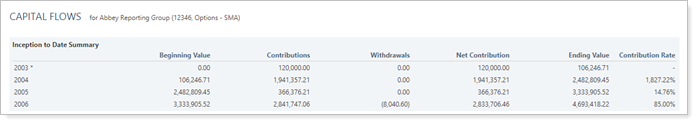
To hide the bar chart, clear Show summary chart based on. No bar chart is displayed.
-
To see the bar chart, select the Show summary chart based on check box. When you select this option, you can then choose from the list either Contribution Rate or Net Contribution.
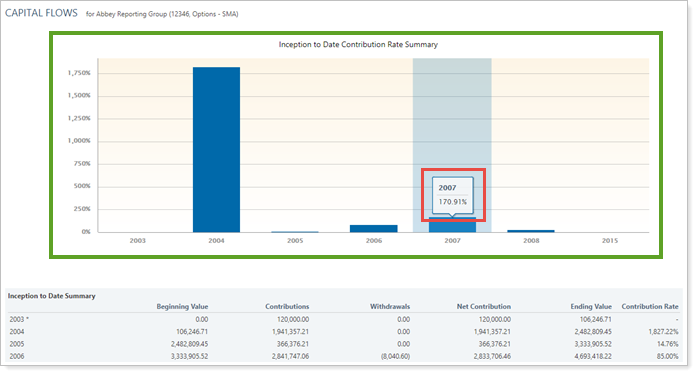
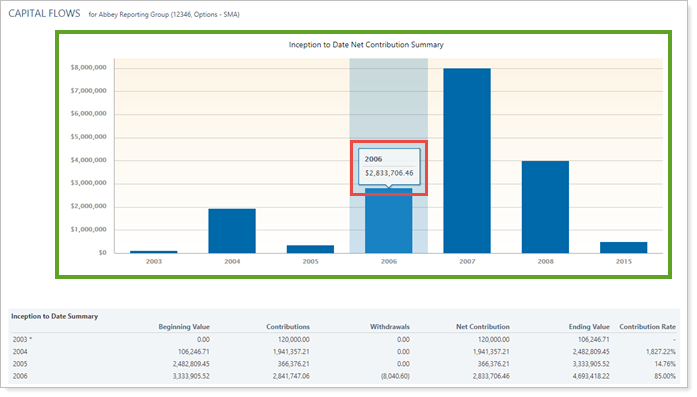
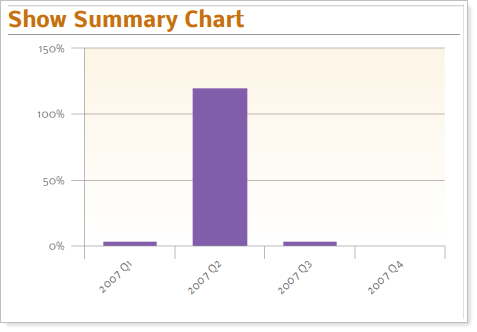
The title of the chart is automatically generated as [Date period] + [Show summary chart based on selection] Summary. For example, in a report, Date period set to Inception to Date and Show summary chart based on set to Net Contribution. The title automatically generated is Inception to Date Net Contribution Summary.
Contribution rate. A bar chart summarizing the contribution rate (%) for the date period is displayed.
Net Contribution. A bar chart summarizing the net contribution ($) for the date period is displayed.
In PDF Reports
Full PDF Report Section
Functionality is the same in the full PDF report template as in dynamic reports.
PDF Dashboard Section
When you add the Capital Flows report to one of the PDF Dashboard panels, you can choose to add one of the three Capital Flows sections to the panel. The options are:
-
Account Value vs. Net Investment Chart
-
Summary
-
Summary Chart
For more information on the summary table or account value vs. net investment chart, see Show Summary and Show Account Values vs. Net Investment Chart.
-
To add the summary chart to the PDF Dashboard panel, click Summary Chart in the Show list.
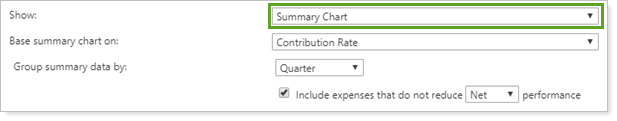
When you add the summary chart, the following additional settings are available: