
Contents
How Group Summary Data By Works
| Applies to: | ||
|---|---|---|
| ✔ Dynamic |
✔ Client Portal |
|
This setting allows you to choose how you want to group the summary data in the summary chart and summary section of the report.
You would choose to group summary data based on the time period of the report and the level of granularity you want. If you're reporting from inception to date, grouping summary data by day will result in a chart with a lot of tiny bars, which may not be the most useful. Grouping by year, on the other hand, will provide a chart that is easier to interpret. Similarly, if you're reporting on a single quarter, you might choose to group by week or month.
In Dynamic Reports

When the report is grouped by Year, the net contributions for each year are divided by the starting value of that year— Inception to date will rarely generate a contribution rate because the calculation will almost always involve dividing by zero.
The Summary chart bar graph shows only date periods with flows.
The Summary table can be set to show date periods without flows using the Include date periods with no flows check box.
You can choose any of the following date ranges:
-
Week
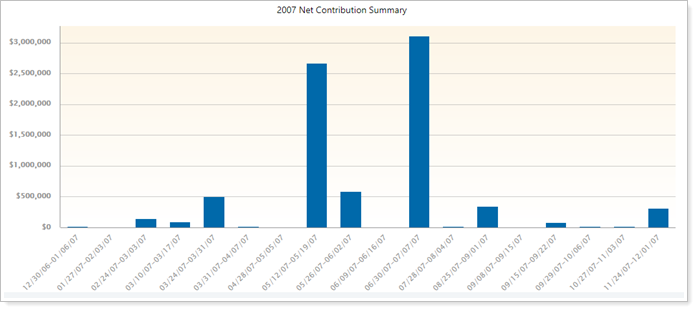
In this example, the date period was set to 2007. Data are shown only for weeks that had flows between January 1, 2007 and December 31, 2007. Weeks without flows are omitted from the chart.
-
Month
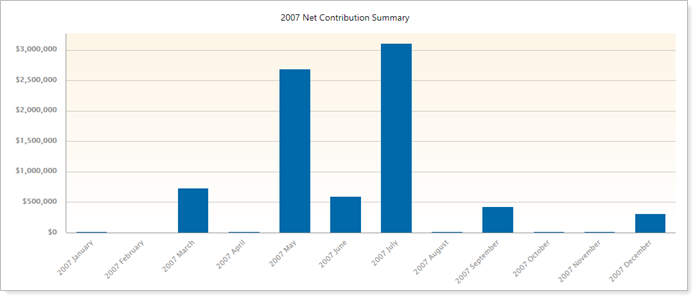
In this example, the date period was set to 2007. In this view some months with very large flows obscure months that have smaller flows.
-
Quarter
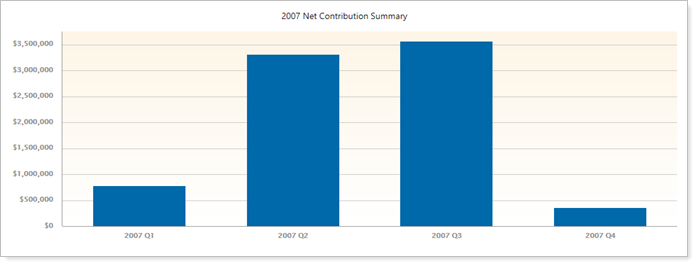
In this example, the date period was set to 2007, with flows for each quarter summarized in one data point.
-
Year
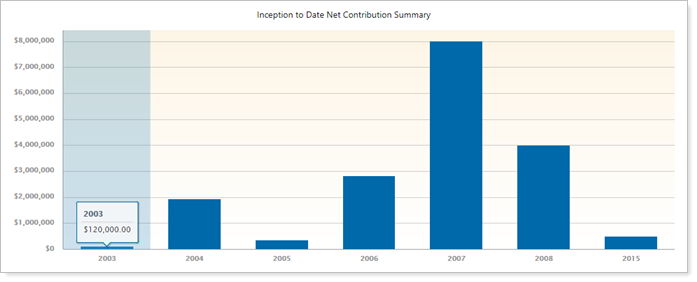
In this example, the date period was set to Inception to Date, with flows for each year summarized in one data point.
In PDF Reports
Functionality is the same in the PDF report templates as in dynamic reports.
Reports With This Setting
Transaction Reports