
Contents
Introduction
| Applies to: | |||
|---|---|---|---|
| ✔ Dynamic | Mobile | ✔ Client Portal | |
The Realized Gains and Losses report displays a table of gains or losses for transactions in an account or group over a specified period. The report allows you to choose columns from a variety of data points and their order in the report, as well as determine up to two levels of sorting. You can also set custom column widths for this report and preview it to determine if the data fits as expected.
The Realized Gains and Losses report is helpful for estimating a client's potential tax burden and for optimizing trading decisions based on realized gains or losses.
Why Use the Realized Gains and Losses Report?
In the Realized Gains and Losses report, you will find versatile sorting options that let you answer many questions about accounts and groups, such as:
-
For this period, what is the difference between cost basis and proceeds of sales? See the realized gains or losses for the account or group for whatever date period you select.
-
How much in gains should the client anticipate being taxed on? Evaluate the tax implications of gains and losses both at the account level and at the group level.
-
When Trading, Where can I optimize for Gains or Losses? Review the current gains and losses in a client's portfolio to help make trading recommendations that reduce the client's overall tax burden.
See the Realized Gains and Losses Report in Action: In a PDF Report
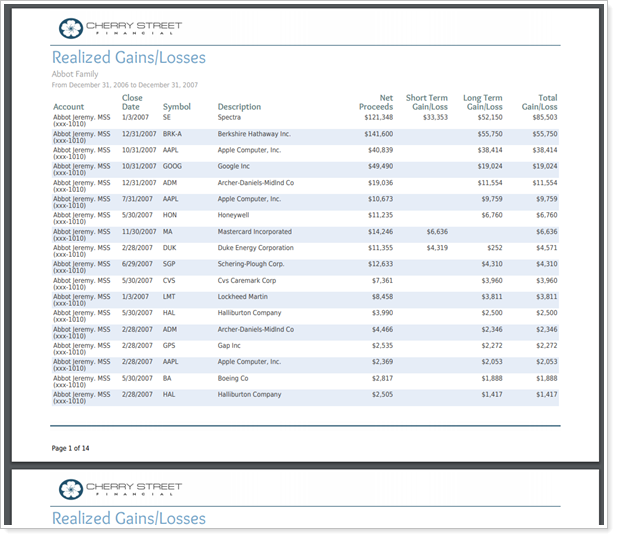
Although the custodian is the final source of record for realized gains and losses, for tax planning purposes, Cherry Street Financial likes to provide clients or their CPAs with estimates of the gains or losses within their accounts on a regular basis.
They use a Realized Gains/Losses PDF template that shows group- and account-level data set to sort by account and then by total gain/loss. It is automatically posted to the client portal.
See the Realized Gains and Losses Report in Action: As a Dynamic Report
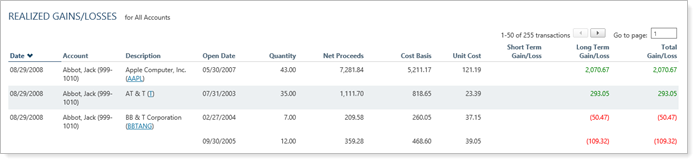
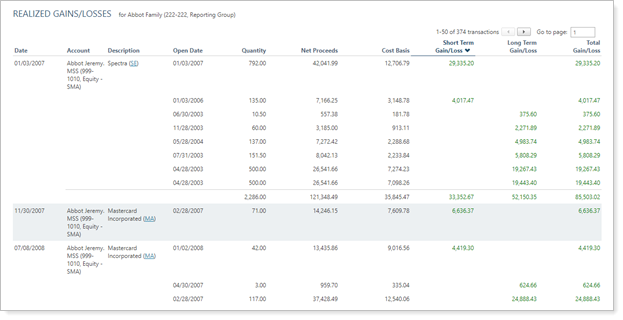
Before making trading recommendations, Cherry Street Financial advisors like to refer to the Realized Gains/Losses report to review the current gains or losses in a client's account. This allows the firm to minimize tax burden as much as possible and to answer the question, "Should I reconsider the funds I'm invested in based on their capital gains?"
They use a dynamic Realized Gains/Losses report sorted to display descending short term gain/loss and then sorted by account. This helps them quickly identify which accounts might benefit from tax optimization.
Features of the Realized Gains and Losses Report
The dynamic report helps you easily filter and sort data to drill down to meaningful results. Interactive reporting features include the following.
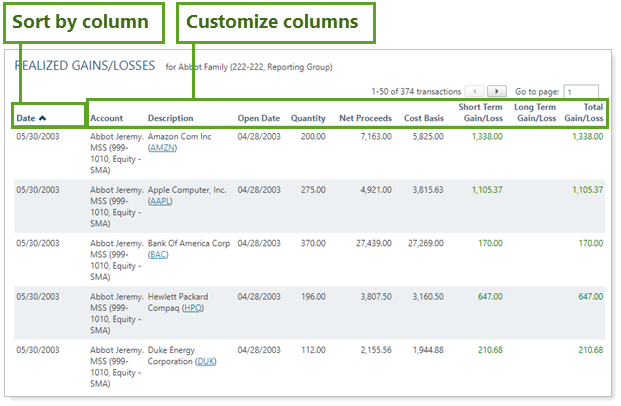
Customizable Data and Display
Display only relevant data. You control what data are displayed and which columns are included, in what order, so you can create the exact report you need.
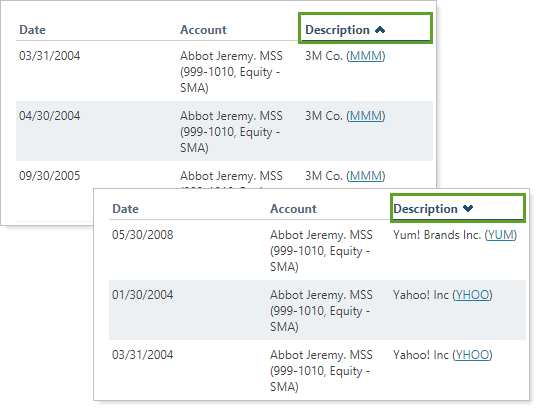
Sort Columns on the Fly
Sort columns by clicking column headers. The caret direction (^ or ˅) indicates sorting order, either ascending or descending.
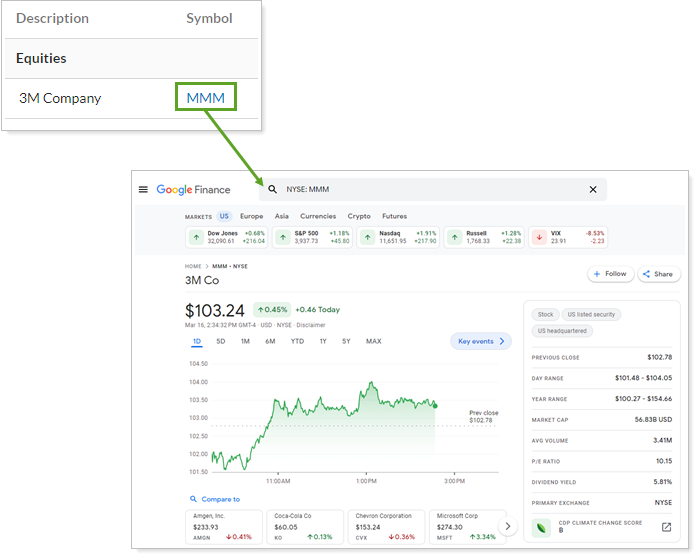
View Security Details
Click the name of a security to view Google Finance information about that security.
You can enable or disable ticker links for each security type.
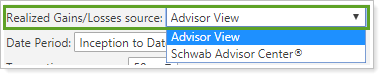
Set the Data Source
You can choose the data source: Either the custodian or Advisor View. If you choose Advisor View, the data could come from your portfolio accounting system, or from the custodian if Use the account custodian as the source of record for the Realized Gains/Losses report is selected. To learn more about setting the data source, see Realized Gains/Losses Source.
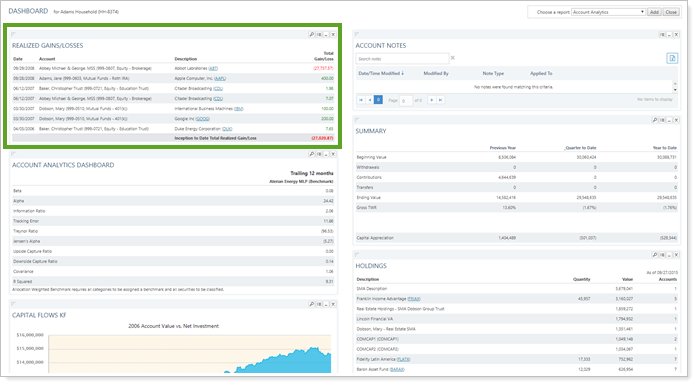
Add Realized Gains and Losses to the Reporting Dashboard
You can use dashboard views to see a pared-down summary of the main dynamic report at a glance on your dashboard.
To learn more about creating and managing dashboard views, see Create and Share Dashboard Views.
For more information on customizing your dashboard, visit Working With Dashboard Modules.
Realized Gains and Losses Report Settings
The following settings are available for the Realized Gains and Losses report. Click the setting name for more details.
| Setting | Details | Available In... | |||
|---|---|---|---|---|---|
| Dynamic Report | PDF Report | Reporting Dashboard | PDF Dashboard |
||
| Report Name | Designate a unique name for the report view. | X | X | ||
| Mark as Publicly Accessible | Share the report view. | X | |||
| Section Title | Designate what the section will be called in the PDF report. | X | X | ||
| Theme | Designate what theme the section will use. | X | |||
| Header and Footer | Choose a unique header and footer for the section or use defaults. | X | |||
| Include Page Break After This Section |
Control where page breaks occur in PDF reports. |
X | |||
| Account Grouping | Control grouping of accounts and groups. | X | |||
| Realized Gains/Losses Source | If you bring in data from Schwab, Fidelity, TD Ameritrade, or other custodians, you can choose to display their data or the data from Tamarac. | X | |||
| Select the date period you want to use for the report. | X | X | X | ||
| Transactions Per Page | Choose how many transactions to display per report page. | X | |||
| Sort First By/Then By | Determine the default order in which the data is displayed. | X | X | X | |
| Include Non-Taxable Accounts | Show or hide non-taxable accounts. | X | X | X | X |
| Show Lot Level Detail | View detailed information about the holdings at the trade lot level. | X | X | ||
| Show Capital Gain Distributions |
Include or exclude capital gain distributions. |
X | X | ||
| Include Page When There Is No Data To Report | Include a blank placeholder space for capital gains distributions if there are no gains for a period. | X | |||
| Available/Selected Columns | Choose which columns are included and in what order. | X | X | X | X |
| Preview |
See a sample of added columns or rows with the selected settings. |
X | |||
Report Actions
To learn more about reports in Tamarac, see Introduction to Reports.
To learn more about how to generate a report, change the data displayed, print or export the report data, and more, see Basics of Working With Reports.
To learn more about creating and using PDF reports, see Understanding PDF Reports and Workflow: Generate a PDF Report.