Contents
Introduction
| Applies to: | |||
|---|---|---|---|
| ✔ Dynamic | ✔ Mobile | ✔ Client Portal | |
The Transactions report displays the transactions for an account or group over a specified period. This report facilitates internal auditing of transactions by displaying only selected transaction types in specific date periods. Additionally, money security settings enable efficient tracking of cash balance changes.
For more information about seeing cash flows, cash in transit, and money security reporting, see Cash in Transit.
Why Use the Transactions Report?
In the Transactions report, you will find versatile sorting and filtering options that let you answer such transaction-related questions about accounts and groups as:
-
What transactions occurred in this account or Group?See all activities within an account for a set date period, or filter with saved searches and configure settings to see only specific transaction types or securities.
-
What are the details of a specific transaction?Filter the report to find only the specific activity or activities you're looking for, then add columns to drill into details of price, quantity, amount, unit cost, and more.
-
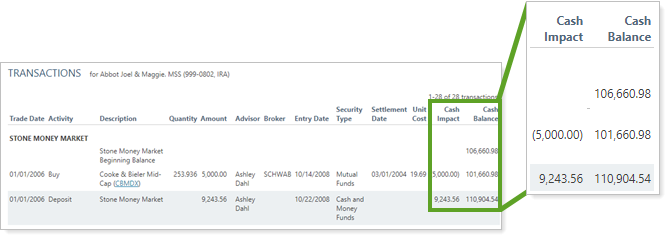
How Did Activities in This period Impact Cash Balance?See the flow of cash in an account and the impact of money security activities on the cash balance.
See the Transaction Report in Action: Tracking Transactions
As part of daily auditing, a firm's administrative staff reviews all transactions within accounts containing recent trades. The Transactions report is set up to display only the previous day's activities, and only the activity types controlled by the firm.

See the Transaction Report in Action: Tracking Money Securities
An advisor notices that an account dipped below the desired cash balance amount and wants to know how this occurred. She configures the Transaction report Group by option to Money Security, which adds the money security columns to the report. This allows her to easily track the impact of every cash transaction on the account's cash balance and to see exactly how the account arrived at its current cash balance.

For more information on using the Money Security option, visit See Cash-Impacting Transactions.
Features of the Transactions Report
The Transactions report helps you easily filter and sort data to drill down to meaningful results. Interactive reporting features include the following.
Track Transactions or Cash Flow
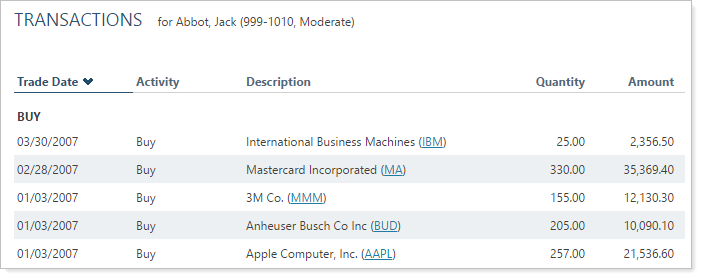
Use the report to evaluate transaction activity or cash flow.
Customize Data and Display
Control inclusion or exclusion of certain securities and activities, set date period and filter by trade or entry date, and filter using existing security saved searches.
Include Only Desired Columns
Display only relevant data. You control what data are displayed and which columns are included, in what order, so you can create the exact report you need.

Sort Columns on the Fly
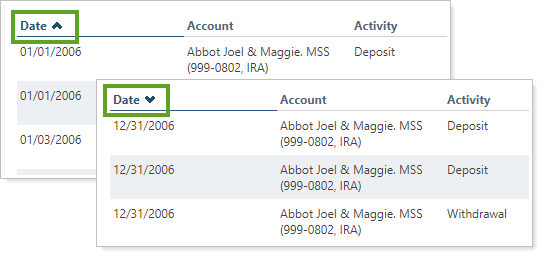
Sort columns by clicking column headers. The caret direction indicates sorting order, either ascending or descending.
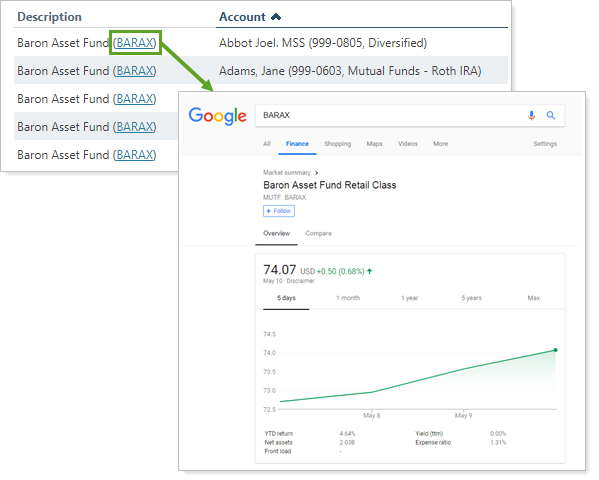
View Security Details
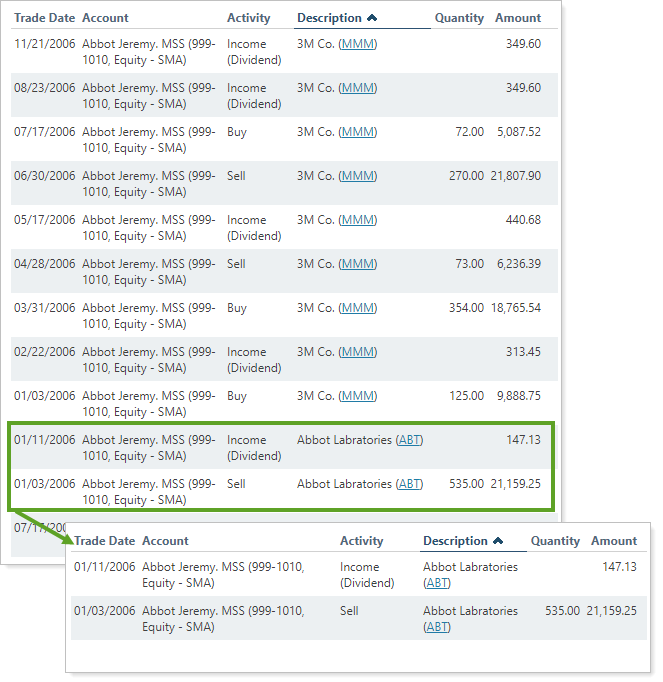
Click the name of a security to view Google Finance information about that security.
You can enable or disable ticker links for each security type.
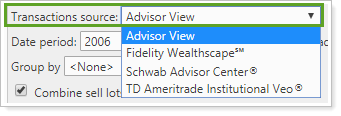
Set the Data Source
You can choose the data source: Either the custodian or Advisor View. If you choose Advisor View, the data could come from your portfolio accounting system, or from the custodian. To learn more about setting the data source, see Transactions Source.
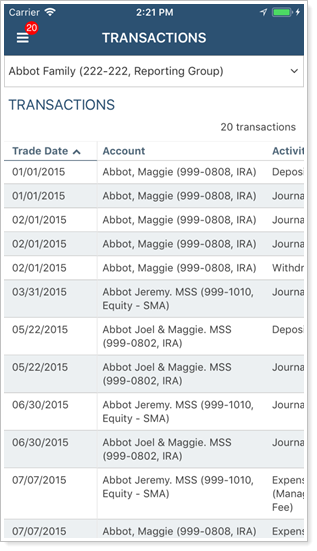
Share on the Mobile App
View the report anywhere. The report is optimized for mobile viewing, making it easy to use on any device, anywhere. To learn more about mobile app report features, see Mobile App Reports.
Add Transactions to the Reporting Dashboard
You can use dashboard views to see a pared-down summary of the main dynamic report at a glance on your dashboard.
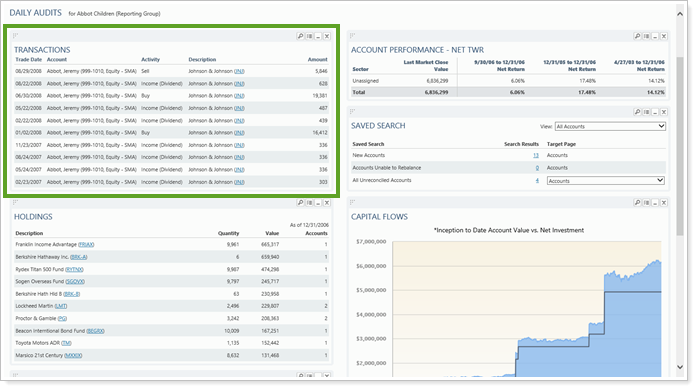
To learn more about creating and managing dashboard views, see Create and Share Dashboard Views.
For more information on customizing your dashboard, visit Working With Dashboard Modules.
Transactions Report Settings
The following settings are available for the Transactions report. Click the setting name for more details.
| Setting | Details | Available In... | ||
|---|---|---|---|---|
| Dynamic Report | PDF Report | Reporting Dashboard | ||
| Report Name | Designate a unique name for the report view. | X | X | |
| Mark as Publicly Accessible | Share the report view. | X | ||
| Transactions Source |
If you bring in data from Schwab, Fidelity, TD Ameritrade, or other custodians, you can choose to display their data or the data from Tamarac. |
X | ||
| Section Title | Designate what the section will be called in the PDF report. | X | ||
| Theme | Designate what theme the section will use. | X | ||
| Header and Footer | Choose a unique header and footer for the section tor use defaults. | X | ||
| Include Page Break After This Section |
Control where page breaks occur in PDF reports. |
X | ||
| Account Grouping | Control grouping of accounts and groups. | X | ||
| Select the date period you want to use for the report. | X | X | X | |
| Apply To | Control whether the trade date or entry date is used. | X | X | X |
| Group By |
Set the report to display all activity types or money security transactions. |
X | X | |
| Combine Sell Lots | Aggregate transactions with matching sell lot IDs. | X | X | X |
| Transactions Per Page | Choose how many transactions to display per page. | X | ||
| Filter By Security Saved Search | Use saved searches to filter the transactions displayed. | X | X | X |
| Exclude or Only Include Transactions Involving These Securities |
Filter the report to include or exclude only transactions involving certain securities. |
X | X | X |
| Add Security |
Designate which securities to include or exclude. |
X | X | X |
| Show the Following Activity Types | Choose which of the listed activity types you see. | X | X | X |
| Available/Selected Columns | Choose which columns are included, in what order. | X | X | |
| Preview | See a sample of the PDF report with the selected settings. | X | ||
Report Actions
To learn more about reports in Tamarac, see Introduction to Reports.
To learn more about how to generate a report, change the data displayed, print or export the report data, and more, see Basics of Working With Reports.
To learn more about creating and using PDF reports, see Understanding PDF Reports and Workflow: Generate a PDF Report.
