
Contents
Introduction
Dashboards give you a customizable at-a-glance view of your data within Tamarac. These views let you monitor potential problem areas, alert you to possible tasks, and generally let you take a look at the data most important to you.
For those who use both Tamarac Reporting and Tamarac Trading, there are two separate dashboards available to use. Depending on your role and the data that's most important to you, you can choose one of these dashboards and customize it to suit your needs:
-
Tamarac Reporting Dashboard.The Tamarac Reporting dashboard aggregates account data based on the reports you've added to the dashboard. You can choose an account, group, or account set and view the updated data based on the account, group, or account set you choose. You can customize the reports as well as save multiple different dashboard views based on your needs.
-
Tamarac Trading Dashboard.The Tamarac Trading dashboard provides fixed widgets designed to help you make quick trading decisions by giving you access to high-level trading and rebalancing data. You can further customize the widgets to show only the data that applies to you.
You can access either dashboard from your Home menu.
Help Video: Trading Dashboard
In this short video, you'll learn about how to use the Trading Dashboard in Tamarac.
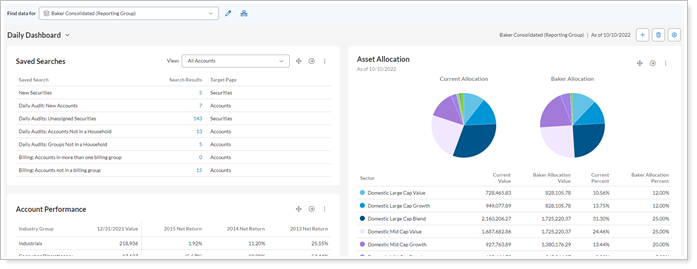
Tamarac Reporting Dashboard Modules and Reports
The Tamarac Reporting dashboard allows you to view abbreviated reports about an account, group, or account set, all in one location. You can create multiple dashboards for yourself, which are only visible to you, and you can share dashboards with others. That means you can create different dashboards for different tasks that monitor different data points—for example, one dashboard for transactions data such as Recent Buys/Sells, and another dashboard to look at performance.
You can add any of the following report modules to the Tamarac Reporting dashboard:
| Report/Module | Description |
|---|---|
| Account Analytics | The Account Analytics report provides a clear comparison of risk-adjusted return for an account or group with designated benchmarks and indexes. |
| Account Notes | The account notes report on the dashboard provides a high-level view of notes within your accounts and groups. |
| Account Performance | The Account Performance report shows account values and performance statistics to tell the story of how an account or group has performed over a designated date range. It helps you understand and troubleshoot TWR for an account or group. |
| Amortization and Accretion | The Amortization and Accretion report shows the amount that each fixed income or mortgage-backed security has amortized or accreted over a specified period of time and provides the necessary year-end fixed income tax reporting. |
| Asset Allocation | The Asset Allocation report offers a tailored picture of a portfolio's makeup. This report shows holdings displayed in a table, pie chart, bar chart, or as allocation over time. |
| Bond Analysis | The Bond Analysis report breaks down bond ratings for fixed income securities to help you evaluate different aspects of a client's bond portfolio. |
| Capital Flows | The Capital Flows report brings together transactions and performance data to show an account or group's contributions and withdrawals over a specified time period. |
| Comparative Review | The Comparative Review report presents account values, contributions, and rates of return (both TWR and IRR) for one specific date period and shows how one account or category did, with the entire group or account set for context. |
| Custom Web Page | The Custom Web Page module allows you to embed specific content from the web such as videos or news feeds directly on your dashboard. |
| Documents | The Documents module allows you to view the most recent documents in clients' accounts and groups. The document vault is a secure cloud-based file storage system available within Tamarac. |
| Holdings | The Holdings report displays the holdings in an account or group, including up to three different grouping levels with subtotals. |
| Income and Expenses | The Income and Expenses report provides a consolidated view of income and expenses for your client portfolios. |
| Maturity Schedule | The Maturity Schedule report displays all securities with upcoming maturities for a specified date range. You can choose which types of fixed income will display in the report. |
| Position Performance | The Position Performance report displays the performance of the portfolio’s individual positions based on selected metrics and groupings. |
| Projected Income | The Projected Income report provides data on expected income from dividends, principal repayments, and coupons. |
| Realized Gains/Losses | The Realized Gains and Losses report is a transactional report that shows all realized gain/loss transactions in the account over a specified period. |
| Saved Searches | The Saved Searches module is an at-a-glance display of up to 25 saved searches, along with the resulting number of accounts, for the saved searches you add to the module. |
| Security Cross-Reference | The Security Cross-Reference report lists all accounts that hold one or more securities that you specify (as of the current trade date). |
| Summary | The Summary report gives a broad overview of what took place in an account or group over one or more date periods. You can display value, flows, benchmarks, returns, and more. |
| Transactions | The Transactions report displays the transactions for an account over a specified period. |
| Unrealized Gains/Losses | The Unrealized Gains and Losses report is a type of holdings report that shows all open trade lots in the account, as well as the gain or loss that would be incurred if the lot was sold on the as of day for the report. |
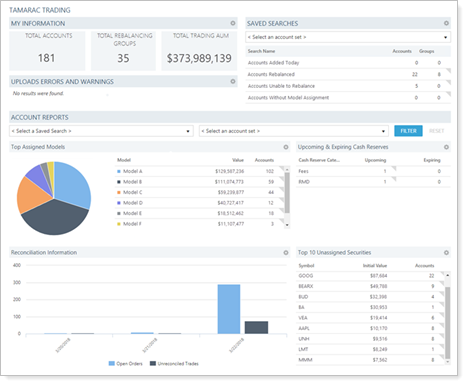
Tamarac Trading Dashboard Widgets
The Tamarac Trading dashboard allows you to customize widgets that give you an at-a-glance view of your trading data. The widgets are fixed and cannot be removed, but each can be customized to show the information most relevant to you. In addition, each user will only see data relevant to those accounts he or she has access to.
You can add any of the following report modules to the Tamarac Trading dashboard:
| Widget | Description |
|---|---|
| My Information | The My Information widget provides a firm-wide summary of your Trading accounts and holdings with three distinct areas: number of accounts, number of rebalancing groups, and trading AUM. |
| Saved Searches | The Saved Searches widget is a customizable list of saved searches and their results, as well as the ability to set direct links for each of those searches. This widget is similar to the Saved Searches dashboard module, found on the Tamarac Reporting dashboard. |
| Upload Errors and Warnings | The Upload Errors and Warnings widget shows the number of upload error and warnings for each data set you add to the widget. |
| Models & Categories | The Models & Categories widget allows you to look across your accounts and see a customizable pie chart that shows top model or category data. |
| Upcoming & Expiring Reserves | The Upcoming & Expiring Reserves widget shows a list of all upcoming or expiring account reserves, along with their corresponding categories, for the date range you specify. |
| Reconciliation Information | The Reconciliation Information widget shows both open orders and unreconciled recent trades by date, allowing you to view the most recent trading activity and take action on it. |
| Securities | The Securities widget allows you to view a list of your top securities and order them by one of several categories. It gives you an at-a-glance view of security holdings. |