 Back
Back|
Back |
|
Amortization and Accretion Report
| Applies to: | |||
|---|---|---|---|
| ✔ Dynamic | Mobile | ✔ Client Portal | |
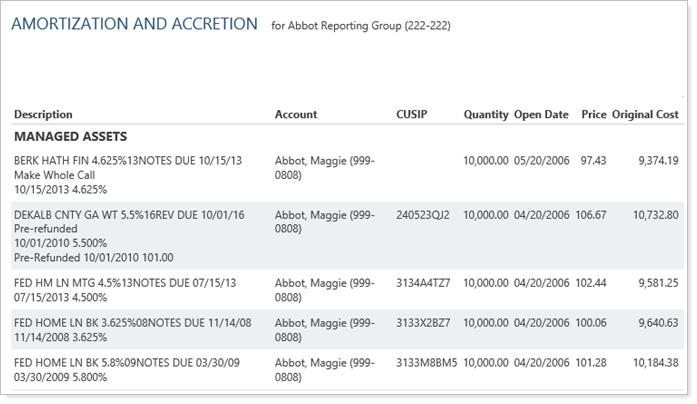
The Amortization and Accretion report displays the amount that a fixed income or mortgage-backed security has amortized or accreted over a specified period of time. It is useful for year-end fixed income tax reporting. This report supplements the Unrealized Gains and Losses report, providing details about current cost basis after amortization.
Tamarac Reporting offers two amortization methods for the report: Scientific method and Straight Line method. You set the amortization method as part of the configuration for this report.
Some setup for accounts and securities is required before you can use this report. For directions, see Workflow: Set Up Securities and Accounts for the Amortization and Accretion Report.
The following table describes some of the differences between scientific method and straight line amortization.
| Scientific Method Amortization | Straight Line Amortization | |
|---|---|---|
| Security Types |
|
|
| Adjustment Distribution | Adjustments gradually increase each period | Adjustments evenly distributed across all periods |
| Requirements |
For each trade lot being amortized:
|
For each trade lot being amortized:
|
| Learn More | Scientific method | Straight Line method |
In the Amortization and Accretion report, you will find options that let you answer amortization-related questions about securities within an account or group, such as:
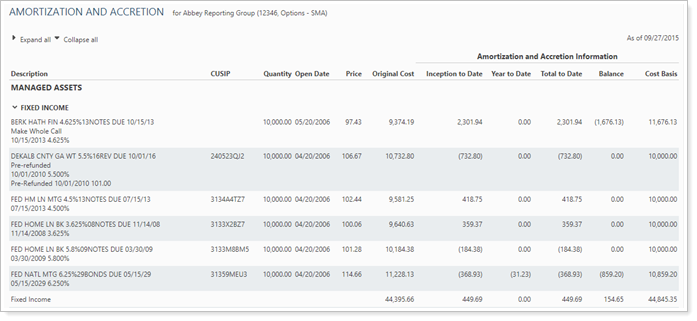
How much has a security amortized over time? Evaluate amortization values over two date periods, as well as total to date, based on the enterprise as-of date.
What is the Cost Basis remaining for the date ranges? See the cost basis after amortization for the securities.
An advisor noticed that a client is overly weighted in fixed income securities and is considering selling a fixed-income securities to rebalance. In order minimize tax burden, the advisor confirms the current cost basis with an Amortization and Accretion report.
The dynamic report helps you easily filter and sort data to drill down to meaningful results. Interactive reporting features include the following.
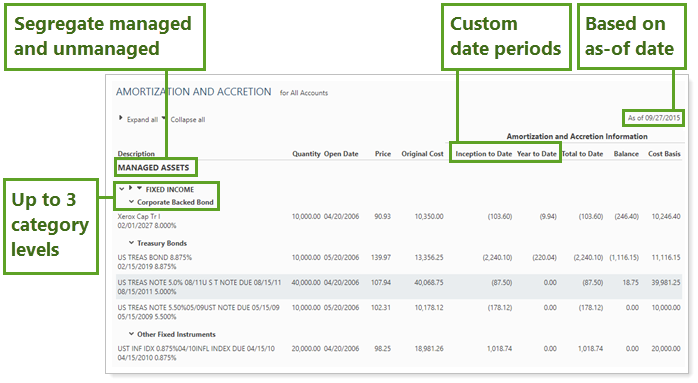
Powerful grouping lets you organize the report in up to three levels to more easily break down large reports.
Display only relevant data. You control what data are displayed and which columns are included, in what order, so you can create the exact report you need. You can even include custom fields.
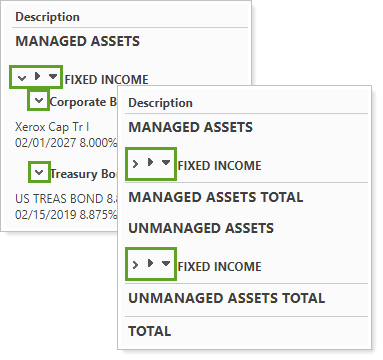
Expand (>) or collapse (˅) table rows to further control the level of detail.
See amortization and accretion information for up to two date periods.
You can customize the name of most selected columns and the Managed/Unmanaged labels used for the headings and captions.
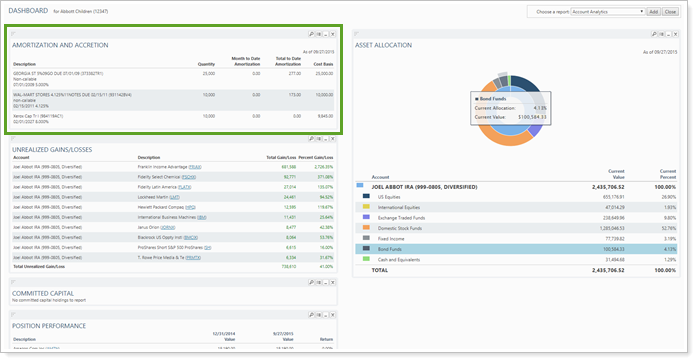
You can use dashboard views to see a pared-down, at-a-glance summary of the main dynamic report on your dashboard.
To learn more about creating and managing dashboard views, see Create and Share Dashboard Views.
For more information on customizing your dashboard, visit Working With Dashboard Modules.
The following settings are available for the Amortization and Accretion report. Click the setting name for more details:
| Setting | Details | Available In... | ||
|---|---|---|---|---|
| Dynamic Report | PDF Report | Reporting Dashboard | ||
| Report Name | Designate a unique name for the report view. | X | X | |
| Mark as Publicly Accessible | Share the report view. | X | ||
| Section Title | Designate what the section will be called in the PDF report. | X | ||
| Theme | Designate what theme the section will use. | X | ||
| Header and Footer | Choose a unique header and footer for the section or use defaults. | X | ||
| Include Page Break After This Section |
Control where page breaks occur in PDF reports. |
X | ||
| Account Grouping | Control grouping of accounts and groups. | X | ||
| Group By/Then By |
Organize a report by various categories. |
X | X | |
| Show Subtotals |
Add subtotals to each grouping level when you Group by. |
X | X | |
| As of Date | Select the date you want to use for the report. | X | X | |
| Select the date period you want to use for the report. | X | |||
| Use Inception Date | Report partial periods in PDF reports for instances where the account or group was opened after the beginning of the date period selected. | X | ||
| Show Subtotals | Display subtotals for each grouping level. | X | ||
| Unmanaged Asset Treatment |
Choose how you want to treat unmanaged assets on the report. For more information about marking securities as unmanaged and how reports display unmanaged assets, see: |
X | X | |
| Combine Group Positions | Combine any common positions that are held within a selected group. | X | ||
| Show Lot Level Detail | View detailed information about the holdings at the trade lot level. | X | ||
| Include Non-Taxable Accounts | Show or hide non-taxable accounts. | X | X | |
| Report SMAs as a Single Line Item | Choose how you want to see SMAs in the report. | X | X | |
| Report Security Groups as a Single Line Item | Choose how you want to see security groups in the report. | X | X | |
| Always Show Totals Row | Include a totals row for every section. | X | ||
| Position Display Option | Designate how individual positions are shown on the report. | X | ||
| Report Direct Member Groups as a Single Line Item |
Show or hide all the direct members of groups within a group. |
X | ||
| Include the Following Security Types | Designate what securities are included in the report. | X | X | |
| Available/Selected Columns | Choose which columns, rows, indices, or benchmarks are included and in what order. | X | X | X |
| Preview |
See a sample of added columns or rows with the selected settings. |
X | ||
| View Top (Number) Holdings, Sorted By | In the dashboard report, designate how holdings are displayed. | X | ||
To learn more about reports in Tamarac, see Introduction to Reports.
To learn more about how to generate a report, change the data displayed, print or export the report data, and more, see Basics of Working With Reports.
To learn more about creating and using PDF reports, see Understanding PDF Reports and Workflow: Generate a PDF Report.