Contents
Introduction
| Applies to: | |||
|---|---|---|---|
| ✔ Dynamic | Mobile | ✔ Client Portal | |
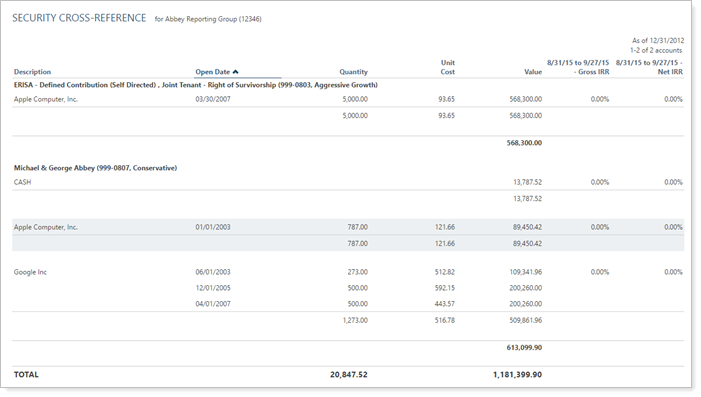
The Security Cross-Reference report lists all accounts that hold one or more securities on the date you set. This report is useful for finding clients impacted by a corporate action or for income reclassification.
You can also use the Security Cross-Reference report to audit manual security snapshots using the Gross IRR and Net IRR columns.
Why Use the Security Cross-Reference Report?
In the Security Cross-Reference report, you will find versatile sorting and filtering options that let you answer questions about accounts holding specific securities, such as:
-
Which of my clients were affected by a corporate action? This report allows you to identify every account that holds a specific security. You might want to do this if a security is about to go through a corporate action, private equity is about to have a capital call, or mutual fund is going through a share class exchange.
-
Am I holding this security in a taxable account? Review taxable accounts to see if they're holding specific securities that may require special tax treatment.
-
Were manual securities entered accurately? Add the IRR column and review returns for manually entered securities to confirm they were entered correctly.
-
Who was holding that as of last quarter end? Find which clients were holding specific securities on a certain date.
Smart Help Video: Security Cross-Reference Report Uses
In this short video, you'll see some examples of the Security Cross-Reference report in action.
See the Security Cross-Reference Report in Action: Find Accounts Holding a Security
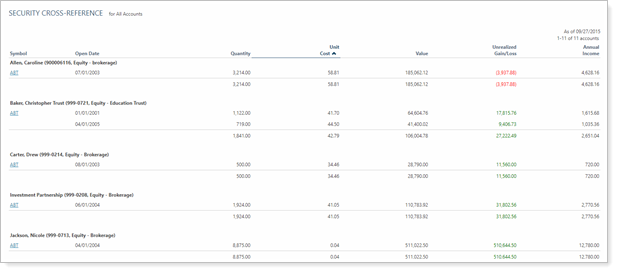
Abbot Laboratories is paying out dividends. The advisors at Cherry Street Financial want to confirm which client accounts will be impacted by this action.
Using the Security Cross-Reference report, they find the accounts holding this security and are able to follow up as appropriate with each.
See the Security Cross-Reference Report in Action: Check Manual Securities Data
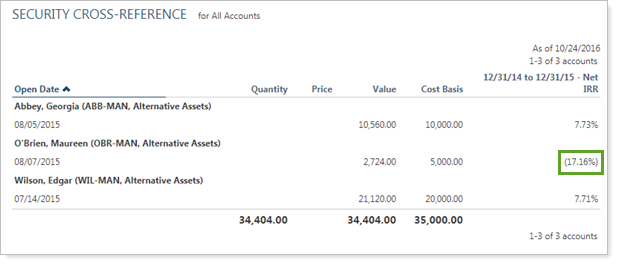
In order to confirm that all the data were entered correctly for manual securities, Cherry Street Financial runs a Security Cross-Reference report including Net IRR. The Net IRR column helps them identify outliers that should be reviewed.
Features of the Security Cross-Reference Report
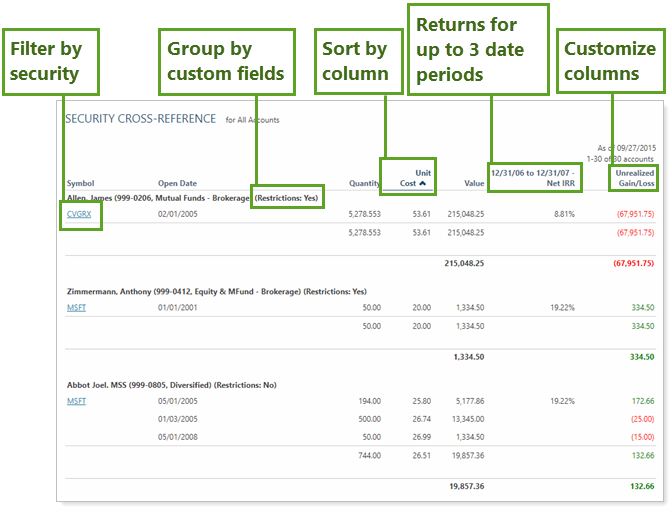
The dynamic report helps you easily filter and sort data to drill down to meaningful results. Interactive reporting features include the following.
Customize Data and Display
Display only relevant data. You control what data are displayed and which columns are included, in what order, so you can create the exact report you need. You can change the name of most columns. For more information, see Available/Selected Columns.
Sort Columns on the Fly
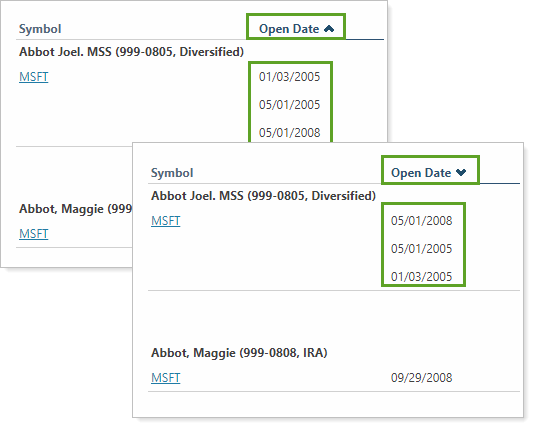
Sort columns by clicking column headers. The caret direction (^ or ˅) indicates sorting order, either ascending or descending. Sorting occurs within each group or account. This means that if you click the Open Date column header to sort by most to least recent, the various holdings within the account or group will be sorted, but the overall group or account order will remain the same.
Filter Data
Powerful filtering lets you see only relevant data points for the designated securities. Control how much detail you see—anything from each position held in all the accounts within a group, to a broad, group-wide holdings summary.
Include Unmanaged Assets
Include unmanaged assets in filtering criteria for holistic asset management.
For more information about marking securities as unmanaged and how reports display unmanaged assets, see:
- How Reports Handle Unmanaged Assets
- Exclude Cash or Other Securities from Performance
- Exclude From Performance/Exclude ALL Securities From Performance
View Security Details
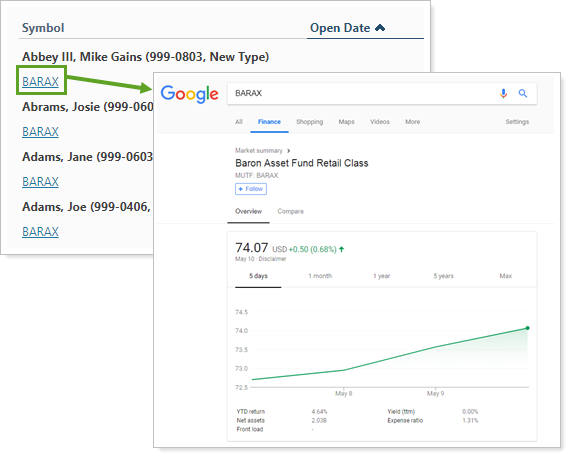
Click the name of a security to view Google Finance information about that security.
You can enable or disable ticker links for each security type.
Add Security Cross-Reference to the Reporting Dashboard
You can use dashboard views to see a pared-down, at-a-glance summary of the main dynamic report on your dashboard.
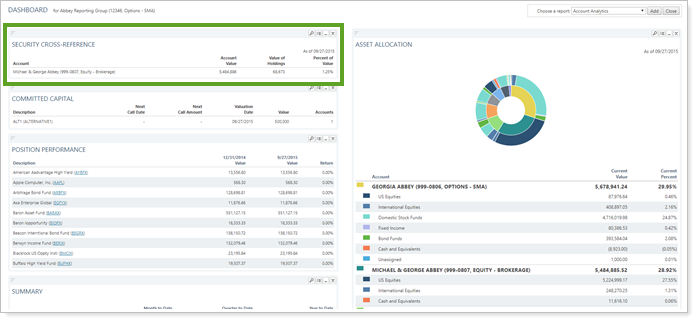
To learn more about creating and managing dashboard views, see Create and Share Dashboard Views.
For more information on customizing your dashboard, visit Working With Dashboard Modules.
Security Cross-Reference Report Settings
The following settings are available for the Security Cross-Reference report. Click the setting name for more details:
| Setting | Details | Available In... | |
|---|---|---|---|
| Dynamic Report | Reporting Dashboard | ||
| Report Name | Designate a unique name for the report view. | X | X |
| Mark as Publicly Accessible | Share the report view. | X | |
| As of Date | Select the date you want to use for the report. | X | X |
| Sub-Group Accounts By | Set how your securities are grouped within your selected sort option. | X | |
| Sort First By/Then By | Determine the default order in which the data is displayed. | X | X |
| Include Unmanaged Assets |
Specify how unmanaged assets are treated in the report. |
X | X |
| Include Non-Taxable Accounts | Show or hide non-taxable accounts. | X | X |
| Include SMAs | Include or exclude separately managed accounts. | X | X |
| Show Lot Level Detail | View detailed information about the holdings at the trade lot level. | X | |
| Available/Selected Columns | Choose which columns are included, in what order. | X | |
| Show Change For | Set the date range for columns that report on a date period. | X | |
| Show Accounts Holding/Not Holding Any/All of These Securities | Set how the report determines which accounts to display based on holdings in those accounts. | X | X |
| View Top (Number) Holdings, Sorted By | In the dashboard report, designate how holdings are displayed. | X | X |
Report Actions
To learn more about reports in Tamarac, see Introduction to Reports.
To learn more about how to generate a report, change the data displayed, print or export the report data, and more, see Basics of Working With Reports.
To learn more about creating and using PDF reports, see Understanding PDF Reports and Workflow: Generate a PDF Report.
